
Purge - 2017 - what'll happen?
-
Man this 'we're gonna sit on our rookie roster and watch them develop ' thing is just horseshit. Too many seasons and too many busts to put up with it anymore. I don't care if you were a top ten pick or a 5th round pick, you've been playing football good enough half your life to make it to the nfl now all of a sudden you can't block tackle or cover? GTFO. Theses guys are young for sure but to show that product on the field rests in the lap of the FO and coaching staff.
Pitiful.
Agree. I've been told that they can't make any halftime adjustments to the game plan for lack of talent. The kids know how to play the game. It's our GM quadrafuck that doesn't get it and coaching that doesn't or can't make game time adjustments.Man this 'we're gonna sit on our rookie roster and watch them develop ' thing is just horseshit. Too many seasons and too many busts to put up with it anymore. I don't care if you were a top ten pick or a 5th round pick, you've been playing football goodvenough half your life to make it to the nfl now all of a sudden you can't block tackle or cover? GTFO. Theses guys are young for sure but to show that product on the field rests in the lap of the FO and coaching staff.
Pitiful.
Hell, even the News Herald is yelling at the Haslam's that they should petition the NFL for a name change. They don't deserve the name Cleveland Browns
-
Not a matter of won't... it's a matter of "can't". You simply cannot land "a few first rate players" in a single draft... it cannot be done.
The only thing your solution obviously is? Impractical...
Ah, but it was indeed done Tour- once. How about 4 HOF guys? 1974 Steelers. Probably never be repeated, but we can hope......

*Lynn Swann, wide receiver, USC, first round, 21st overall.
*Jack Lambert, linebacker, Kent State, second round, 46th overall.
*John Stallworth, wide receiver, Alabama A&M, fourth round, 82nd overall.
*Mike Webster, center, Wisconsin, fifth round, 125th overall
Ah, but it was indeed done Tour- once. How about 4 HOF guys? 1974 Steelers. Probably never be repeated, but we can hope......
*Lynn Swann, wide receiver, USC, first round, 21st overall.
*Jack Lambert, linebacker, Kent State, second round, 46th overall.
*John Stallworth, wide receiver, Alabama A&M, fourth round, 82nd overall.
*Mike Webster, center, Wisconsin, fifth round, 125th overall
lol... if it helps you sleep better, h, then I'll not mention that you're one player shy of "a few" by my count...

At a base level, maybe, since the chart indicates that there might not be a significant drop off in career value from the second to the third round...or even from the first to the second.
However, applying sample data here is a dangerous game, since we are dealing with individuals and not groups. What's more important, in my opinion, is the variance. That's what allows for more informed decisions when applying sample data to the individual - exactly what we're doing when we make draft picks.
No doubt... if there's a prospect who is in danger of leaving the board that we have to have, then, yes, there's a chance we'll try to make a trade. But the difference in valuations of the 2 charts is so vastly different that it is hard to see us pulling the trigger.
Let's say we want to move our 1st pick in R3 (#65 overall) to R2's 53rd overall. By the traditional chart the 53rd's value is 370 and our 65th overall's is 265. Depending on the number of compensatories handed out at the end of R3 our first pick in R4 should make up the difference of ~100 points. So a traditional deal of:
#65 + #98 ---> #65... or in points 265+108 = 373 ---> 370
should get done.
But looking at the deal through Harvard's eyes brings a much different points evaluation of:
128.0+89.5 = 217.5 -----> 142.8!!!
In essence Harvard's chart says you are trading away half again, 150%, of the value you are getting. And if you believe in the Harvard chart then the player you'd be targeting has to be a faller you had pegged for the late first round... a player you'd already presumably have passed over three times including early in R2 when his value was first in line with your pick.
The only way I'd pursue such a deal is if I saw a gap developing in my board that devalued the two picks I was trading away and I did not see an advantageous trade-down developing.
This does not mean we can't get "that player" as there is another, far more economical means to land him/them ... reaching/over-drafting them. Not that this is a spur of the moment thing... it's not... it's an outcome of our big board process. It's what we did pretty clearly did with Kessler and arguably a "few" others in the 2016 draft. I look for a repeat in 2017.
Man this 'we're gonna sit on our rookie roster and watch them develop ' thing is just horseshit. Too many seasons and too many busts to put up with it anymore. I don't care if you were a top ten pick or a 5th round pick, you've been playing football goodvenough half your life to make it to the nfl now all of a sudden you can't block tackle or cover? GTFO. Theses guys are young for sure but to show that product on the field rests in the lap of the FO and coaching staff.
Just as High School players get culled in college, so, too, do college kids get culled in the Pros. Always has been that way; always will be that way.
Sometimes it is simply a matter of no longer being able to control whomever is in front of you... because "whomever" is suddenly a different player, one much better than the one you blocked/tackled/covered at the last level.
"When you have a shared vision it is a lot easier to make unpopular decisions." - Paul DePodesta "When you win, say nothing. When you lose, say less." - Paul Brown Complete 2017 Browns Board Mock: http://thebrownsboard.com/forums/index.php?showtopic=46196 -
Why do you come up with the number of 20. If they draft 13-14, and they want to keep them all, wouldn't that number be 13 or 14?
its in the op.....I also listed 6 players returning from IR....14+6 = 20
its in the op.....I also listed 6 players returning from IR....14+6 = 20
OK, the IR guys.
Who are the guys on IR that you want to run?
-
Not a matter of won't... it's a matter of "can't". You simply cannot land "a few first rate players" in a single draft... it cannot be done.
Id say most teams have a goal to score 2 -3 players each draft......and they are allotted 7 picks each.....
So....with that in mind.....what is the goal when you have 14 picks?....and 5 inside the top 65?......
Definitely should have at least a "few first rate players" as your objective.....
Id say most teams have a goal to score 2 -3 players each draft......and they are allotted 7 picks each.....
So....with that in mind.....what is the goal when you have 14 picks?....and 5 inside the top 65?......
Definitely should have at least a "few first rate players" as your objective.....
Well....ordinarily you would have had a number of your previous first round picks serving as a veteran base....
But, in the Browns case they have like only 3 of those guys.....2 of which go back a long way: Haden/Thomas.
So, to me, 4 out of those top 5 need to become solid starters for this team pretty much off the bat. And eventually 1 or two stars.
(the QB and one other....though a 1974 Steelers like draft would be nice, no?)
-
Not a matter of won't... it's a matter of "can't". You simply cannot land "a few first rate players" in a single draft... it cannot be done.
The only thing your solution obviously is? Impractical...
Ah, but it was indeed done Tour- once. How about 4 HOF guys? 1974 Steelers. Probably never be repeated, but we can hope......
*Lynn Swann, wide receiver, USC, first round, 21st overall.
*Jack Lambert, linebacker, Kent State, second round, 46th overall.
*John Stallworth, wide receiver, Alabama A&M, fourth round, 82nd overall.
*Mike Webster, center, Wisconsin, fifth round, 125th overall
Ah, but it was indeed done Tour- once. How about 4 HOF guys? 1974 Steelers. Probably never be repeated, but we can hope......
*Lynn Swann, wide receiver, USC, first round, 21st overall.
*Jack Lambert, linebacker, Kent State, second round, 46th overall.
*John Stallworth, wide receiver, Alabama A&M, fourth round, 82nd overall.
*Mike Webster, center, Wisconsin, fifth round, 125th overall
How about at least a Browns 1978 draft? Actually, we need better than that. While the Browns got Clay Matthews and Ozzie Newsone...not a single other draft pick that year was much good. Except maybe Johnny Evans, the punter they took.
-
If we use the Harvard chart, as I suspect we do for obvious reasons, instead of the "standard" NFL chart, then we value picks too much to package and move up.
At a base level, maybe, since the chart indicates that there might not be a significant drop off in career value from the second to the third round...or even from the first to the second.
However, applying sample data here is a dangerous game, since we are dealing with individuals and not groups. What's more important, in my opinion, is the variance. That's what allows for more informed decisions when applying sample data to the individual - exactly what we're doing when we make draft picks.
For example, the coefficient of variation drastically increases the further in the draft you move along, meaning that later picks are infinitely more volatile and harder to predict compared to earlier picks, contrary to what many in here have stated.
Yes, it's true...a first round bust hurts much more than a fifth round bust. But that doesn't mean that picking a first round player is harder. On the contrary, the Harvard study shows that you have a statistically better chance of picking a legitimate contributing player in the early rounds compared to the later rounds.
The "Harvard chart" draws three broadstroke conclusions:
- On average, there isn't as drastic of a statistical dropoff in players careers from one round to the next as we thought.
- There is a much larger degree of variance in the career trajectories of late round picks than there is in early round players.
- The potential of picking a superstar player significantly diminishes the further into the draft you get.
Looking at this roster, I'm not seeing a lack of contributing members, I'm seeing a lack of high-level superstar potential.
At a very generalized level, the article calls Josh McCown essentially "Mr. NFL Average" - a CAV of 15 and what should be expected for a third round pick based on their findings. He's a marginal player who is, at best, a spot starter but really is a mid-to-high level backup. Meanwhile, the first overall pick is a Rodney Harrison.
We have a ton of Josh McCown's, yet few Rodney Harrison's.
If I'm in this FO, I'm looking at the revamped "Harvard chart" and putting my eggs in the 10-40 pick range. That allows us the chance to take a handful of players that are more statistically likely to be above the "McCown-level", with the distinct possibility of achieving the "Harrison-level".
(And, though it shouldn't have to be said, this study shows that one should never expect a Manning-level contributor, even at the top pick. Those are an anomaly. The highest you should ever expect from a #1 QB is a career similar to that of Rich Gannon or Drew Bledsoe. Just want to make sure that's noted again.)
At a base level, maybe, since the chart indicates that there might not be a significant drop off in career value from the second to the third round...or even from the first to the second.
However, applying sample data here is a dangerous game, since we are dealing with individuals and not groups. What's more important, in my opinion, is the variance. That's what allows for more informed decisions when applying sample data to the individual - exactly what we're doing when we make draft picks.
For example, the coefficient of variation drastically increases the further in the draft you move along, meaning that later picks are infinitely more volatile and harder to predict compared to earlier picks, contrary to what many in here have stated.
Yes, it's true...a first round bust hurts much more than a fifth round bust. But that doesn't mean that picking a first round player is harder. On the contrary, the Harvard study shows that you have a statistically better chance of picking a legitimate contributing player in the early rounds compared to the later rounds.
The "Harvard chart" draws three broadstroke conclusions:
- On average, there isn't as drastic of a statistical dropoff in players careers from one round to the next as we thought.
- There is a much larger degree of variance in the career trajectories of late round picks than there is in early round players.
- The potential of picking a superstar player significantly diminishes the further into the draft you get.
Looking at this roster, I'm not seeing a lack of contributing members, I'm seeing a lack of high-level superstar potential.
At a very generalized level, the article calls Josh McCown essentially "Mr. NFL Average" - a CAV of 15 and what should be expected for a third round pick based on their findings. He's a marginal player who is, at best, a spot starter but really is a mid-to-high level backup. Meanwhile, the first overall pick is a Rodney Harrison.
We have a ton of Josh McCown's, yet few Rodney Harrison's.
If I'm in this FO, I'm looking at the revamped "Harvard chart" and putting my eggs in the 10-40 pick range. That allows us the chance to take a handful of players that are more statistically likely to be above the "McCown-level", with the distinct possibility of achieving the "Harrison-level".
(And, though it shouldn't have to be said, this study shows that one should never expect a Manning-level contributor, even at the top pick. Those are an anomaly. The highest you should ever expect from a #1 QB is a career similar to that of Rich Gannon or Drew Bledsoe. Just want to make sure that's noted again.)
There are always exceptions to the rule. In the Browns case....taking a first round pick is almost certain to mean he is a bust.
But...OK, hopefully that will change and they will become somewhat normal.
-
Ah, but it was indeed done Tour- once. How about 4 HOF guys? 1974 Steelers. Probably never be repeated, but we can hope......
*Lynn Swann, wide receiver, USC, first round, 21st overall.
*Jack Lambert, linebacker, Kent State, second round, 46th overall.
*John Stallworth, wide receiver, Alabama A&M, fourth round, 82nd overall.
*Mike Webster, center, Wisconsin, fifth round, 125th overall
lol... if it helps you sleep better, h, then I'll not mention that you're one player shy of "a few" by my count...
At a base level, maybe, since the chart indicates that there might not be a significant drop off in career value from the second to the third round...or even from the first to the second.
However, applying sample data here is a dangerous game, since we are dealing with individuals and not groups. What's more important, in my opinion, is the variance. That's what allows for more informed decisions when applying sample data to the individual - exactly what we're doing when we make draft picks.
No doubt... if there's a prospect who is in danger of leaving the board that we have to have, then, yes, there's a chance we'll try to make a trade. But the difference in valuations of the 2 charts is so vastly different that it is hard to see us pulling the trigger.
Let's say we want to move our 1st pick in R3 (#65 overall) to R2's 53rd overall. By the traditional chart the 53rd's value is 370 and our 65th overall's is 265. Depending on the number of compensatories handed out at the end of R3 our first pick in R4 should make up the difference of ~100 points. So a traditional deal of:
#65 + #98 ---> #65... or in points 265+108 = 373 ---> 370
should get done.
But looking at the deal through Harvard's eyes brings a much different points evaluation of:
128.0+89.5 = 217.5 -----> 142.8!!!
In essence Harvard's chart says you are trading away half again, 150%, of the value you are getting. And if you believe in the Harvard chart then the player you'd be targeting has to be a faller you had pegged for the late first round... a player you'd already presumably have passed over three times including early in R2 when his value was first in line with your pick.
The only way I'd pursue such a deal is if I saw a gap developing in my board that devalued the two picks I was trading away and I did not see an advantageous trade-down developing.
This does not mean we can't get "that player" as there is another, far more economical means to land him/them ... reaching/over-drafting them. Not that this is a spur of the moment thing... it's not... it's an outcome of our big board process. It's what we did pretty clearly did with Kessler and arguably a "few" others in the 2016 draft. I look for a repeat in 2017.
Man this 'we're gonna sit on our rookie roster and watch them develop ' thing is just horseshit. Too many seasons and too many busts to put up with it anymore. I don't care if you were a top ten pick or a 5th round pick, you've been playing football goodvenough half your life to make it to the nfl now all of a sudden you can't block tackle or cover? GTFO. Theses guys are young for sure but to show that product on the field rests in the lap of the FO and coaching staff.
Just as High School players get culled in college, so, too, do college kids get culled in the Pros. Always has been that way; always will be that way.
Sometimes it is simply a matter of no longer being able to control whomever is in front of you... because "whomever" is suddenly a different player, one much better than the one you blocked/tackled/covered at the last level.
lol... if it helps you sleep better, h, then I'll not mention that you're one player shy of "a few" by my count...
No doubt... if there's a prospect who is in danger of leaving the board that we have to have, then, yes, there's a chance we'll try to make a trade. But the difference in valuations of the 2 charts is so vastly different that it is hard to see us pulling the trigger.
Let's say we want to move our 1st pick in R3 (#65 overall) to R2's 53rd overall. By the traditional chart the 53rd's value is 370 and our 65th overall's is 265. Depending on the number of compensatories handed out at the end of R3 our first pick in R4 should make up the difference of ~100 points. So a traditional deal of:
#65 + #98 ---> #65... or in points 265+108 = 373 ---> 370
should get done.
But looking at the deal through Harvard's eyes brings a much different points evaluation of:
128.0+89.5 = 217.5 -----> 142.8!!!
In essence Harvard's chart says you are trading away half again, 150%, of the value you are getting. And if you believe in the Harvard chart then the player you'd be targeting has to be a faller you had pegged for the late first round... a player you'd already presumably have passed over three times including early in R2 when his value was first in line with your pick.
The only way I'd pursue such a deal is if I saw a gap developing in my board that devalued the two picks I was trading away and I did not see an advantageous trade-down developing.
https://harvardsportsanalysis.files.wordpress.com/2011/11/career-value1.jpg
https://harvardsportsanalysis.files.wordpress.com/2011/11/variatoin.jpg
That's a fine way to look at it when assuming you're going to get the average player for that pick and you are trying to amass foundational talent... however I am of the opinion we are at a spot where we are looking to strike on high-impact players with a higher chance of achieving a high CAV - and statistics say that it is easier to do that with higher picks rather than lower ones.
I don't think we're going to be mortgaging the future by any means, but I believe we'll be using our capital to nab four, if not five, early round picks that, statistically speaking, have a higher probability of having above average careers. Looking at the (admittedly dated) charts, that puts you firmly in the 0-45 range, as even the lower boundary is still higher than the higher boundary of many mid-to-late round picks, starting as early as the third round.
Given that there is essentially a leveling off after round three, it's not outside the realm of reason that we package our third and fourth round picks to move up into the second, while still maintaining our fifth, sixth and seventh round picks. Statistically speaking, we are still be able to achieve the same success with late round picks as we are with mid-round picks. The variance is higher, but the floor is not that much lower at pick 106 than it is at 206 (or later)....while the ceiling is almost equally as high.
I haven't been able to find this study, but I'd venture a bet to say that most Super Bowl teams have at least X number of "superstar" players - that is, players with a CAV of at least Y. At some point we have to strike at talent.
I'm awesome, and I fuck dolphins. Ghoolie 12/2/2012: I have absolutely no skills, training or pride -
fewfyo͞o/adjective & pronoundeterminer: few; adjective: few; comparative adjective: fewer; superlative adjective: fewest
-
1.a small number of."may I ask a few questions?"
synonyms:
a small number, a handful, one or two, a couple, two or three; Morenot many, hardly any"there weren't many biscuits, but we saved you a few" -
2.used to emphasize how small a number of people or things is."he had few friends"
synonyms:
scarce, scant, meager, insufficient, in short supply; More
-
-
OK, the IR guys.
Who are the guys on IR that you want to run?
That too is listed in the OP......not gonna rewrite it for ya Gip.....#tryreading
-
lol... if it helps you sleep better, h, then I'll not mention that you're one player shy of "a few" by my count...
No doubt... if there's a prospect who is in danger of leaving the board that we have to have, then, yes, there's a chance we'll try to make a trade. But the difference in valuations of the 2 charts is so vastly different that it is hard to see us pulling the trigger.
Let's say we want to move our 1st pick in R3 (#65 overall) to R2's 53rd overall. By the traditional chart the 53rd's value is 370 and our 65th overall's is 265. Depending on the number of compensatories handed out at the end of R3 our first pick in R4 should make up the difference of ~100 points. So a traditional deal of:
#65 + #98 ---> #65... or in points 265+108 = 373 ---> 370
should get done.
But looking at the deal through Harvard's eyes brings a much different points evaluation of:
128.0+89.5 = 217.5 -----> 142.8!!!
In essence Harvard's chart says you are trading away half again, 150%, of the value you are getting. And if you believe in the Harvard chart then the player you'd be targeting has to be a faller you had pegged for the late first round... a player you'd already presumably have passed over three times including early in R2 when his value was first in line with your pick.
The only way I'd pursue such a deal is if I saw a gap developing in my board that devalued the two picks I was trading away and I did not see an advantageous trade-down developing.
https://harvardsportsanalysis.files.wordpress.com/2011/11/career-value1.jpg
https://harvardsportsanalysis.files.wordpress.com/2011/11/variatoin.jpg
That's a fine way to look at it when assuming you're going to get the average player for that pick and you are trying to amass foundational talent... however I am of the opinion we are at a spot where we are looking to strike on high-impact players with a higher chance of achieving a high CAV - and statistics say that it is easier to do that with higher picks rather than lower ones.
I don't think we're going to be mortgaging the future by any means, but I believe we'll be using our capital to nab four, if not five, early round picks that, statistically speaking, have a higher probability of having above average careers. Looking at the (admittedly dated) charts, that puts you firmly in the 0-45 range, as even the lower boundary is still higher than the higher boundary of many mid-to-late round picks, starting as early as the third round.
Given that there is essentially a leveling off after round three, it's not outside the realm of reason that we package our third and fourth round picks to move up into the second, while still maintaining our fifth, sixth and seventh round picks. Statistically speaking, we are still be able to achieve the same success with late round picks as we are with mid-round picks. The variance is higher, but the floor is not that much lower at pick 106 than it is at 206 (or later)....while the ceiling is almost equally as high.
I haven't been able to find this study, but I'd venture a bet to say that most Super Bowl teams have at least X number of "superstar" players - that is, players with a CAV of at least Y. At some point we have to strike at talent.
Ah... the dictionary card hits the table.
Have you honestly ever thought of "a couple" and "a few" as synonyms, Ag?
That's a fine way to look at it when assuming you're going to get the average player for that pick and you are trying to amass foundational talent... however I am of the opinion we are at a spot where we are looking to strike on high-impact players with a higher chance of achieving a high CAV - and statistics say that it is easier to do that with higher picks rather than lower ones.
I don't think we're going to be mortgaging the future by any means, but I believe we'll be using our capital to nab four, if not five, early round picks that, statistically speaking, have a higher probability of having above average careers. Looking at the (admittedly dated) charts, that puts you firmly in the 0-45 range, as even the lower boundary is still higher than the higher boundary of many mid-to-late round picks, starting as early as the third round.The lower boundary what? The lower boundary is 0 across the entire range... so not sure what you are referring to. Nonetheless I think that I better understand where you're going now... so I can more firmly disagree.
First, I do not think we are at that "spot" as yet. Too many holes remain alongside too many marginal incumbents.Second, were I trying to still amass foundational talent, then I'd be advocating trading down. I'm not and I don't need to as we've amassed a good number of 2017 picks thanks to our 2016 trading and lack of UFA retention.
I see 2016 as having been the great amassing... 2017 as the year of standing pat... and 2018 being the year of adding pieces. In other words I'm a year behind you. In that vein I would not be shocked to see "a couple" of the 3rd/4th rounders you see as being traded up this year instead being traded up and out to 2018 creating more ammo.
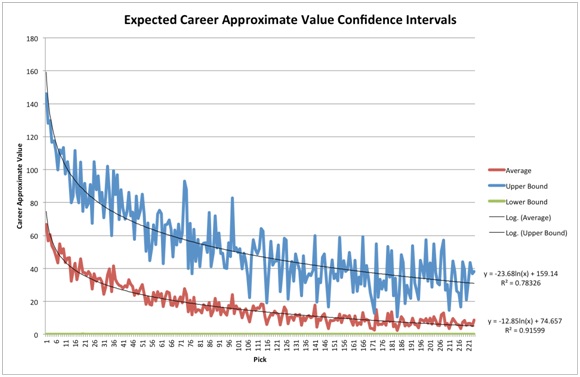
A few notes on the chart...
- I believe the upper bound is a true boundary, i.e., the single highest CAV in the study period for that draft position. I would like to see the median values plotted as opposed to the mean.
- I see where you are going with your line at pick 45, but were you to represent the curve with three straight lines, then the first might cover as low as #11, the second #55-ish and the last the rest.
- There appears to be a "sweet spot" between #33 and #51 where the average spends almost all its time at or above the curve fitted line.
- The opposite appears to be true for the interval between #115 and 140.
- Both the above likely normalize as the sample size expands, but are interesting occurrences... especially the "sweet spot" where a lot of one time first rounders who fall get taken.
"When you have a shared vision it is a lot easier to make unpopular decisions." - Paul DePodesta "When you win, say nothing. When you lose, say less." - Paul Brown Complete 2017 Browns Board Mock: http://thebrownsboard.com/forums/index.php?showtopic=46196 -
Ah, but it was indeed done Tour- once. How about 4 HOF guys? 1974 Steelers. Probably never be repeated, but we can hope......
*Lynn Swann, wide receiver, USC, first round, 21st overall.
*Jack Lambert, linebacker, Kent State, second round, 46th overall.
*John Stallworth, wide receiver, Alabama A&M, fourth round, 82nd overall.
*Mike Webster, center, Wisconsin, fifth round, 125th overall
lol... if it helps you sleep better, h, then I'll not mention that you're one player shy of "a few" by my count...
At a base level, maybe, since the chart indicates that there might not be a significant drop off in career value from the second to the third round...or even from the first to the second.
However, applying sample data here is a dangerous game, since we are dealing with individuals and not groups. What's more important, in my opinion, is the variance. That's what allows for more informed decisions when applying sample data to the individual - exactly what we're doing when we make draft picks.
No doubt... if there's a prospect who is in danger of leaving the board that we have to have, then, yes, there's a chance we'll try to make a trade. But the difference in valuations of the 2 charts is so vastly different that it is hard to see us pulling the trigger.
Let's say we want to move our 1st pick in R3 (#65 overall) to R2's 53rd overall. By the traditional chart the 53rd's value is 370 and our 65th overall's is 265. Depending on the number of compensatories handed out at the end of R3 our first pick in R4 should make up the difference of ~100 points. So a traditional deal of:
#65 + #98 ---> #65... or in points 265+108 = 373 ---> 370
should get done.
But looking at the deal through Harvard's eyes brings a much different points evaluation of:
128.0+89.5 = 217.5 -----> 142.8!!!
In essence Harvard's chart says you are trading away half again, 150%, of the value you are getting. And if you believe in the Harvard chart then the player you'd be targeting has to be a faller you had pegged for the late first round... a player you'd already presumably have passed over three times including early in R2 when his value was first in line with your pick.
The only way I'd pursue such a deal is if I saw a gap developing in my board that devalued the two picks I was trading away and I did not see an advantageous trade-down developing.
This does not mean we can't get "that player" as there is another, far more economical means to land him/them ... reaching/over-drafting them. Not that this is a spur of the moment thing... it's not... it's an outcome of our big board process. It's what we did pretty clearly did with Kessler and arguably a "few" others in the 2016 draft. I look for a repeat in 2017.
Man this 'we're gonna sit on our rookie roster and watch them develop ' thing is just horseshit. Too many seasons and too many busts to put up with it anymore. I don't care if you were a top ten pick or a 5th round pick, you've been playing football goodvenough half your life to make it to the nfl now all of a sudden you can't block tackle or cover? GTFO. Theses guys are young for sure but to show that product on the field rests in the lap of the FO and coaching staff.
Just as High School players get culled in college, so, too, do college kids get culled in the Pros. Always has been that way; always will be that way.
Sometimes it is simply a matter of no longer being able to control whomever is in front of you... because "whomever" is suddenly a different player, one much better than the one you blocked/tackled/covered at the last level.
Just as High School players get culled in college, so, too, do college kids get culled in the Pros. Always has been that way; always will be that way.
Sometimes it is simply a matter of no longer being able to control whomever is in front of you... because "whomever" is suddenly a different player, one much better than the one you blocked/tackled/covered at the last level.
complacency at it's finest.
only a beat down browns fan thinks that way.
-
Ah... the dictionary card hits the table.
Have you honestly ever thought of "a couple" and "a few" as synonyms, Ag?
That's a fine way to look at it when assuming you're going to get the average player for that pick and you are trying to amass foundational talent... however I am of the opinion we are at a spot where we are looking to strike on high-impact players with a higher chance of achieving a high CAV - and statistics say that it is easier to do that with higher picks rather than lower ones.
I don't think we're going to be mortgaging the future by any means, but I believe we'll be using our capital to nab four, if not five, early round picks that, statistically speaking, have a higher probability of having above average careers. Looking at the (admittedly dated) charts, that puts you firmly in the 0-45 range, as even the lower boundary is still higher than the higher boundary of many mid-to-late round picks, starting as early as the third round.The lower boundary what? The lower boundary is 0 across the entire range... so not sure what you are referring to. Nonetheless I think that I better understand where you're going now... so I can more firmly disagree.
First, I do not think we are at that "spot" as yet. Too many holes remain alongside too many marginal incumbents.Second, were I trying to still amass foundational talent, then I'd be advocating trading down. I'm not and I don't need to as we've amassed a good number of 2017 picks thanks to our 2016 trading and lack of UFA retention.
I see 2016 as having been the great amassing... 2017 as the year of standing pat... and 2018 being the year of adding pieces. In other words I'm a year behind you. In that vein I would not be shocked to see "a couple" of the 3rd/4th rounders you see as being traded up this year instead being traded up and out to 2018 creating more ammo.
A few notes on the chart...
- I believe the upper bound is a true boundary, i.e., the single highest CAV in the study period for that draft position. I would like to see the median values plotted as opposed to the mean.
- I see where you are going with your line at pick 45, but were you to represent the curve with three straight lines, then the first might cover as low as #11, the second #55-ish and the last the rest.
- There appears to be a "sweet spot" between #33 and #51 where the average spends almost all its time at or above the curve fitted line.
- The opposite appears to be true for the interval between #115 and 140.
- Both the above likely normalize as the sample size expands, but are interesting occurrences... especially the "sweet spot" where a lot of one time first rounders who fall get taken.
Ah... the dictionary card hits the table.
Have you honestly ever thought of "a couple" and "a few" as synonyms, Ag?
Nah. A couple is 2 and few is 3. Maybe 4 in a stretch. Certainly not 5 for me. That there is a "bunch" where I come from.

But seriously I was thinking 3 when I first typed it in. 4 if we got really really lucky.
-
Just as High School players get culled in college, so, too, do college kids get culled in the Pros. Always has been that way; always will be that way.
Sometimes it is simply a matter of no longer being able to control whomever is in front of you... because "whomever" is suddenly a different player, one much better than the one you blocked/tackled/covered at the last level.
complacency at it's finest.
only a beat down browns fan thinks that way.
OK... in that case I'll not mention the the cited synonym of "handful"...
complacency at it's finest.
only a beat down browns fan thinks that way.
Maybe you can give me some lessons in faux outrage, mik? You know, so I can be a better "fan".
On 2nd thought.... Nah... I'd rather stay in touch with reality.
-
as long as you're alright with it tour then browns nation is alright with it.
just like we aren't tanking it this year.
losing is one thing. not giving a shit about it is another. 1 year. 2 year. 3 year. 4 year plan.
a broken record with no new turntable.
-
as long as you're alright with it tour then browns nation is alright with it.
just like we aren't tanking it this year.
losing is one thing. not giving a shit about it is another. 1 year. 2 year. 3 year. 4 year plan.
a broken record with no new turntable.
a broken record with no new turntable.
Trust me, my friend... I have plenty of turntables...
Anyone need a refurbished AR-XA?
"When you have a shared vision it is a lot easier to make unpopular decisions." - Paul DePodesta "When you win, say nothing. When you lose, say less." - Paul Brown Complete 2017 Browns Board Mock: http://thebrownsboard.com/forums/index.php?showtopic=46196 -
Ah... the dictionary card hits the table.
Have you honestly ever thought of "a couple" and "a few" as synonyms, Ag?
That's a fine way to look at it when assuming you're going to get the average player for that pick and you are trying to amass foundational talent... however I am of the opinion we are at a spot where we are looking to strike on high-impact players with a higher chance of achieving a high CAV - and statistics say that it is easier to do that with higher picks rather than lower ones.
I don't think we're going to be mortgaging the future by any means, but I believe we'll be using our capital to nab four, if not five, early round picks that, statistically speaking, have a higher probability of having above average careers. Looking at the (admittedly dated) charts, that puts you firmly in the 0-45 range, as even the lower boundary is still higher than the higher boundary of many mid-to-late round picks, starting as early as the third round.The lower boundary what? The lower boundary is 0 across the entire range... so not sure what you are referring to. Nonetheless I think that I better understand where you're going now... so I can more firmly disagree.
First, I do not think we are at that "spot" as yet. Too many holes remain alongside too many marginal incumbents.Second, were I trying to still amass foundational talent, then I'd be advocating trading down. I'm not and I don't need to as we've amassed a good number of 2017 picks thanks to our 2016 trading and lack of UFA retention.
I see 2016 as having been the great amassing... 2017 as the year of standing pat... and 2018 being the year of adding pieces. In other words I'm a year behind you. In that vein I would not be shocked to see "a couple" of the 3rd/4th rounders you see as being traded up this year instead being traded up and out to 2018 creating more ammo.
A few notes on the chart...
- I believe the upper bound is a true boundary, i.e., the single highest CAV in the study period for that draft position. I would like to see the median values plotted as opposed to the mean.
- I see where you are going with your line at pick 45, but were you to represent the curve with three straight lines, then the first might cover as low as #11, the second #55-ish and the last the rest.
- There appears to be a "sweet spot" between #33 and #51 where the average spends almost all its time at or above the curve fitted line.
- The opposite appears to be true for the interval between #115 and 140.
- Both the above likely normalize as the sample size expands, but are interesting occurrences... especially the "sweet spot" where a lot of one time first rounders who fall get taken.
<p>
Ah... the dictionary card hits the table.
Have you honestly ever thought of "a couple" and "a few" as synonyms, Ag?
The lower boundary what? The lower boundary is 0 across the entire range... so not sure what you are referring to. Nonetheless I think that I better understand where you're going now... so I can more firmly disagree.
First, I do not think we are at that "spot" as yet. Too many holes remain alongside too many marginal incumbents.
Second, were I trying to still amass foundational talent, then I'd be advocating trading down. I'm not and I don't need to as we've amassed a good number of 2017 picks thanks to our 2016 trading and lack of UFA retention.
I see 2016 as having been the great amassing... 2017 as the year of standing pat... and 2018 being the year of adding pieces. In other words I'm a year behind you. In that vein I would not be shocked to see "a couple" of the 3rd/4th rounders you see as being traded up this year instead being traded up and out to 2018 creating more ammo.
A few notes on the chart...
- I believe the upper bound is a true boundary, i.e., the single highest CAV in the study period for that draft position. I would like to see the median values plotted as opposed to the mean.
- I see where you are going with your line at pick 45, but were you to represent the curve with three straight lines, then the first might cover as low as #11, the second #55-ish and the last the rest.
- There appears to be a "sweet spot" between #33 and #51 where the average spends almost all its time at or above the curve fitted line.
- The opposite appears to be true for the interval between #115 and 140.
- Both the above likely normalize as the sample size expands, but are interesting occurrences... especially the "sweet spot" where a lot of one time first rounders who fall get taken.
Sorry...the lower boundary, to me, is the average CAV line.
IMO, anything below the average CAV for that draft position is considered a bust, therefore the average position is the lowest acceptable boundary for me in this scenario.
The difference in our philosophies is that I don't foresee a
bad team as ever being a position of standing pat. To me, you are either building or striking. You don't stand pat until you've become routinely competitive.
Since I don't believe in standing pat for us, and since I believe we've added a wide foundation of young talent, I naturally believe we've transitioned into a phase of striking
I've been saying for years (as have you IIRC, I remember having similar conversations in the past) that we needed not to build our roster from the top down, but first from the bottom up. I believe we've achieved this. Guys like Reiter, Boddy-Calhoun, Reynolds, Burley, DeValve, Kessler, Meder, Davis, Johnson, Lemonier, Kindred, etc. are our new bottom. Each has shown at least one or two flashes enough to warrant extended looks, meaning they possess enough talent to earn a paycheck in this league...something I don't believe we've had at the bottom of our roster in a while. Most of our bottom feeders were rarely able to hang on with other clubs. Hell, many of our top players were barely able to hang on.
And here's the kicker: A team consisting almost solely of bottoms (yeah, yeah...I get it) has been able to stay competitive in multiple games this season.
Now is not the time to continue to feed from the bottom, now is the time we add talent from the top down. And I don't see us being able to do that with fourth rounders.
- I agree about the three stages of the draft, I just believe that 11-45 range to have the highest ROI. It would simply cost too much to break into the top ten, but that mid first to early second region is cheaper and can still provide you with legitimate franchise-changing potential.
-
Since it's a statistical confidence limit chart the boundaries are not open to definition, but I hear you wanting above average prospects... who doesn't?
Pretty sure you understand, but just to be sure... when I say "stand pat" I am only talking about this draft... as in letting it come to us. To me it is the logical intermediate step between amassing picks via trading down and targeting high-impact prospects.
I, too, recall discussions we've had around building a team. I know I've always been a proponent of front to back and, especially on D, inside out. Bottom up? Don't recall thinking of it that way, but, sure... if the general sense of through the draft without being tempted by FA shortcuts is where you are, then so am I. And our current disagreement may be over how complete our foundation is.
Couple more interesting observations on the graph...
- the multiple between the two, fitted trend-lines increases from ~2x for #1 to ~6x for pick #220+;
- since all pick sets include at least one 0 CAV draftee then the above multiple is a reflection of the variance of each pick's data; and
- the ratio of the difference between the mean and the upper boundary line, and the value of the upper boundary line approximates the percentage of below average CAVs for a given pick.
The last point takes you from ~50/50 for pick #1 to about 6 in 7, or 86/14 for the late picks.
-
Geek talk is fun.










Hello! It looks like you're interested in this conversation, but you don't have an account yet.
Getting fed up of having to scroll through the same posts each visit? When you register for an account, you'll always come back to exactly where you were before, and choose to be notified of new replies (either via email, or push notification). You'll also be able to save bookmarks and upvote posts to show your appreciation to other community members.
With your input, this post could be even better 💗
Register Login