
Actually curious
-
Fraud water for the CDC listed by state and by month. 2018 and 2019 no 2020 data yet.
WSS
-
-
Thanks for looking that up!
WSS
It's in my "Library" on here -

-
So the COVID19 ACTUALLY LOWERED THE DEATH RATE! MAGA!
-
Please Steve, be better than taking JAFBFs word for anything. ESPECIALLY anything related to statistics. There are multiple glaring considerations he takes zero account for in his "conclusion" above.
The first, something to consider from a statistical sense, is the death rate evey week the same?
I'm really trying to be kind here but has anything JAFBF's posted led you to believe he has any grasp on data analysis?
-
Please Steve, be better than taking JAFBFs word for anything. ESPECIALLY anything related to statistics. There are multiple glaring considerations he takes zero account for in his "conclusion" above.
The first, something to consider from a statistical sense, is the death rate evey week the same?
I'm really trying to be kind here but has anything JAFBF's posted led you to believe he has any grasp on data analysis?
Please Steve, be better than taking JAFBFs word for anything. ESPECIALLY anything related to statistics. There are multiple glaring considerations he takes zero account for in his "conclusion" above.
The first, something to consider from a statistical sense, is the death rate evey week the same?
I'm really trying to be kind here but has anything JAFBF's posted led you to believe he has any grasp on data analysis?
But yet you have nothing to refute his facts other than insults.
-
Please Steve, be better than taking JAFBFs word for anything. ESPECIALLY anything related to statistics. There are multiple glaring considerations he takes zero account for in his "conclusion" above.
The first, something to consider from a statistical sense, is the death rate evey week the same?
I'm really trying to be kind here but has anything JAFBF's posted led you to believe he has any grasp on data analysis?
But yet you have nothing to refute his facts other than insults.
But yet you have nothing to refute his facts other than insults.
I led with one thing to consider when interpreting the data. Why the conclusion listed above is a bad one should be obvious with some common sense.
-
I led with one thing to consider when interpreting the data. Why the conclusion listed above is a bad one should be obvious with some common sense.
Back it up with stats and facts now please...show your work.
-
I led with one thing to consider when interpreting the data. Why the conclusion listed above is a bad one should be obvious with some common sense.
Back it up with stats and facts now please...show your work.
Back it up with stats and facts now please...show your work.
I'm not saying the stats above are incorrect. I'm saying the conclusion is. Data can be interested many ways, and too many times it can be done incorrectly without considering all/more factors.
What is your belief based on the data above? That there is some conspiracy to lower death numbers or raise COVID? Occam's Razor is a thing, and it applies here.
-
Bird boy with the HUGE fail
be grateful that the numbers are not deadly
-
I'm sure you could find that data online
I'm not saying the stats above are incorrect. I'm saying the conclusion is. Data can be interested many ways, and too many times it can be done incorrectly without considering all/more factors.
What is your belief based on the data above? That there is some conspiracy to lower death numbers or raise COVID? Occam's Razor is a thing, and it applies here.
First you say you're sure the data can be found online.
The data is found but you don't like it.
The least you can do is find the data you like since you're sure it can be found.
-
I'm sure you could find that data online
I'm not saying the stats above are incorrect. I'm saying the conclusion is. Data can be interested many ways, and too many times it can be done incorrectly without considering all/more factors.
What is your belief based on the data above? That there is some conspiracy to lower death numbers or raise COVID? Occam's Razor is a thing, and it applies here.
First you say you're sure the data can be found online.
The data is found but you don't like it.
The least you can do is find the data you like since you're sure it can be found.
First you say you're sure the data can be found online.
The data is found but you don't like it.
The least you can do is find the data you like since you're sure it can be found.
No no no. I never said I "don't like" the data. The data is the data. It is the CDC's numbers.
I am saying the analysis and conclusion are bad/wrong.
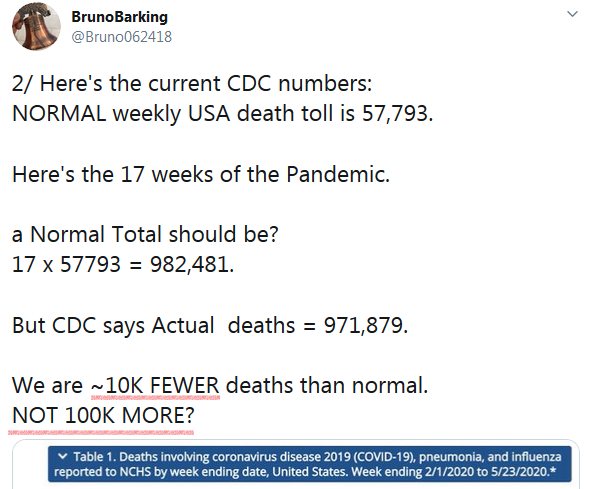
How about this, maybe I jumped the gun. What do you think the conclusion is of the data and tweet JAFBAF posted above? What do you think the conclusion is?
Ja.brill Peppers - Cleveland Brown OldBrownsFan, on 02 Jun 2017 - 5:09PM said: "No you are not the work of the devil but you are deceived by the devil." Who's got it better than us? Nooooobody! -
I'm sure you could find that data online
I'm not saying the stats above are incorrect. I'm saying the conclusion is. Data can be interested many ways, and too many times it can be done incorrectly without considering all/more factors.
What is your belief based on the data above? That there is some conspiracy to lower death numbers or raise COVID? Occam's Razor is a thing, and it applies here.
First you say you're sure the data can be found online.
The data is found but you don't like it.
The least you can do is find the data you like since you're sure it can be found.
First you say you're sure the data can be found online.
The data is found but you don't like it.
The least you can do is find the data you like since you're sure it can be found.
Um, how about a small sample size. I'd like to throw out the first seven weeks where total covid deaths were <100. Or the Outlier of 5\23 where total deaths were running around 40,000 less than the average. I'd need to see the data for the next three weeks to make sure that week's (at least) two standard deviations below the norm is for real, or as I suspect an outlier.... instead of a trend.
Not saying it's inaccurate, but you can manipulate sample parameters to prove damn near anything.... What I can say is 971k\81k covid deaths = about 8% of all deaths. And I did notice the "totals" probably include stuff like cancer, heart attacks, traffic fatalities, overdoses and suicides- I'd assume. And if you ignore the first few weeks, that percentage due to covid is going to go way up, and I'm not about to calculate it.
-
First you say you're sure the data can be found online.
The data is found but you don't like it.
The least you can do is find the data you like since you're sure it can be found.
No no no. I never said I "don't like" the data. The data is the data. It is the CDC's numbers.
I am saying the analysis and conclusion are bad/wrong.
How about this, maybe I jumped the gun. What do you think the conclusion is of the data and tweet JAFBAF posted above? What do you think the conclusion is?
No no no. I never said I "don't like" the data. The data is the data. It is the CDC's numbers.
I am saying the analysis and conclusion are bad/wrong.
How about this, maybe I jumped the gun. What do you think the conclusion is of the data and tweet JAFBAF posted above? What do you think the conclusion is?
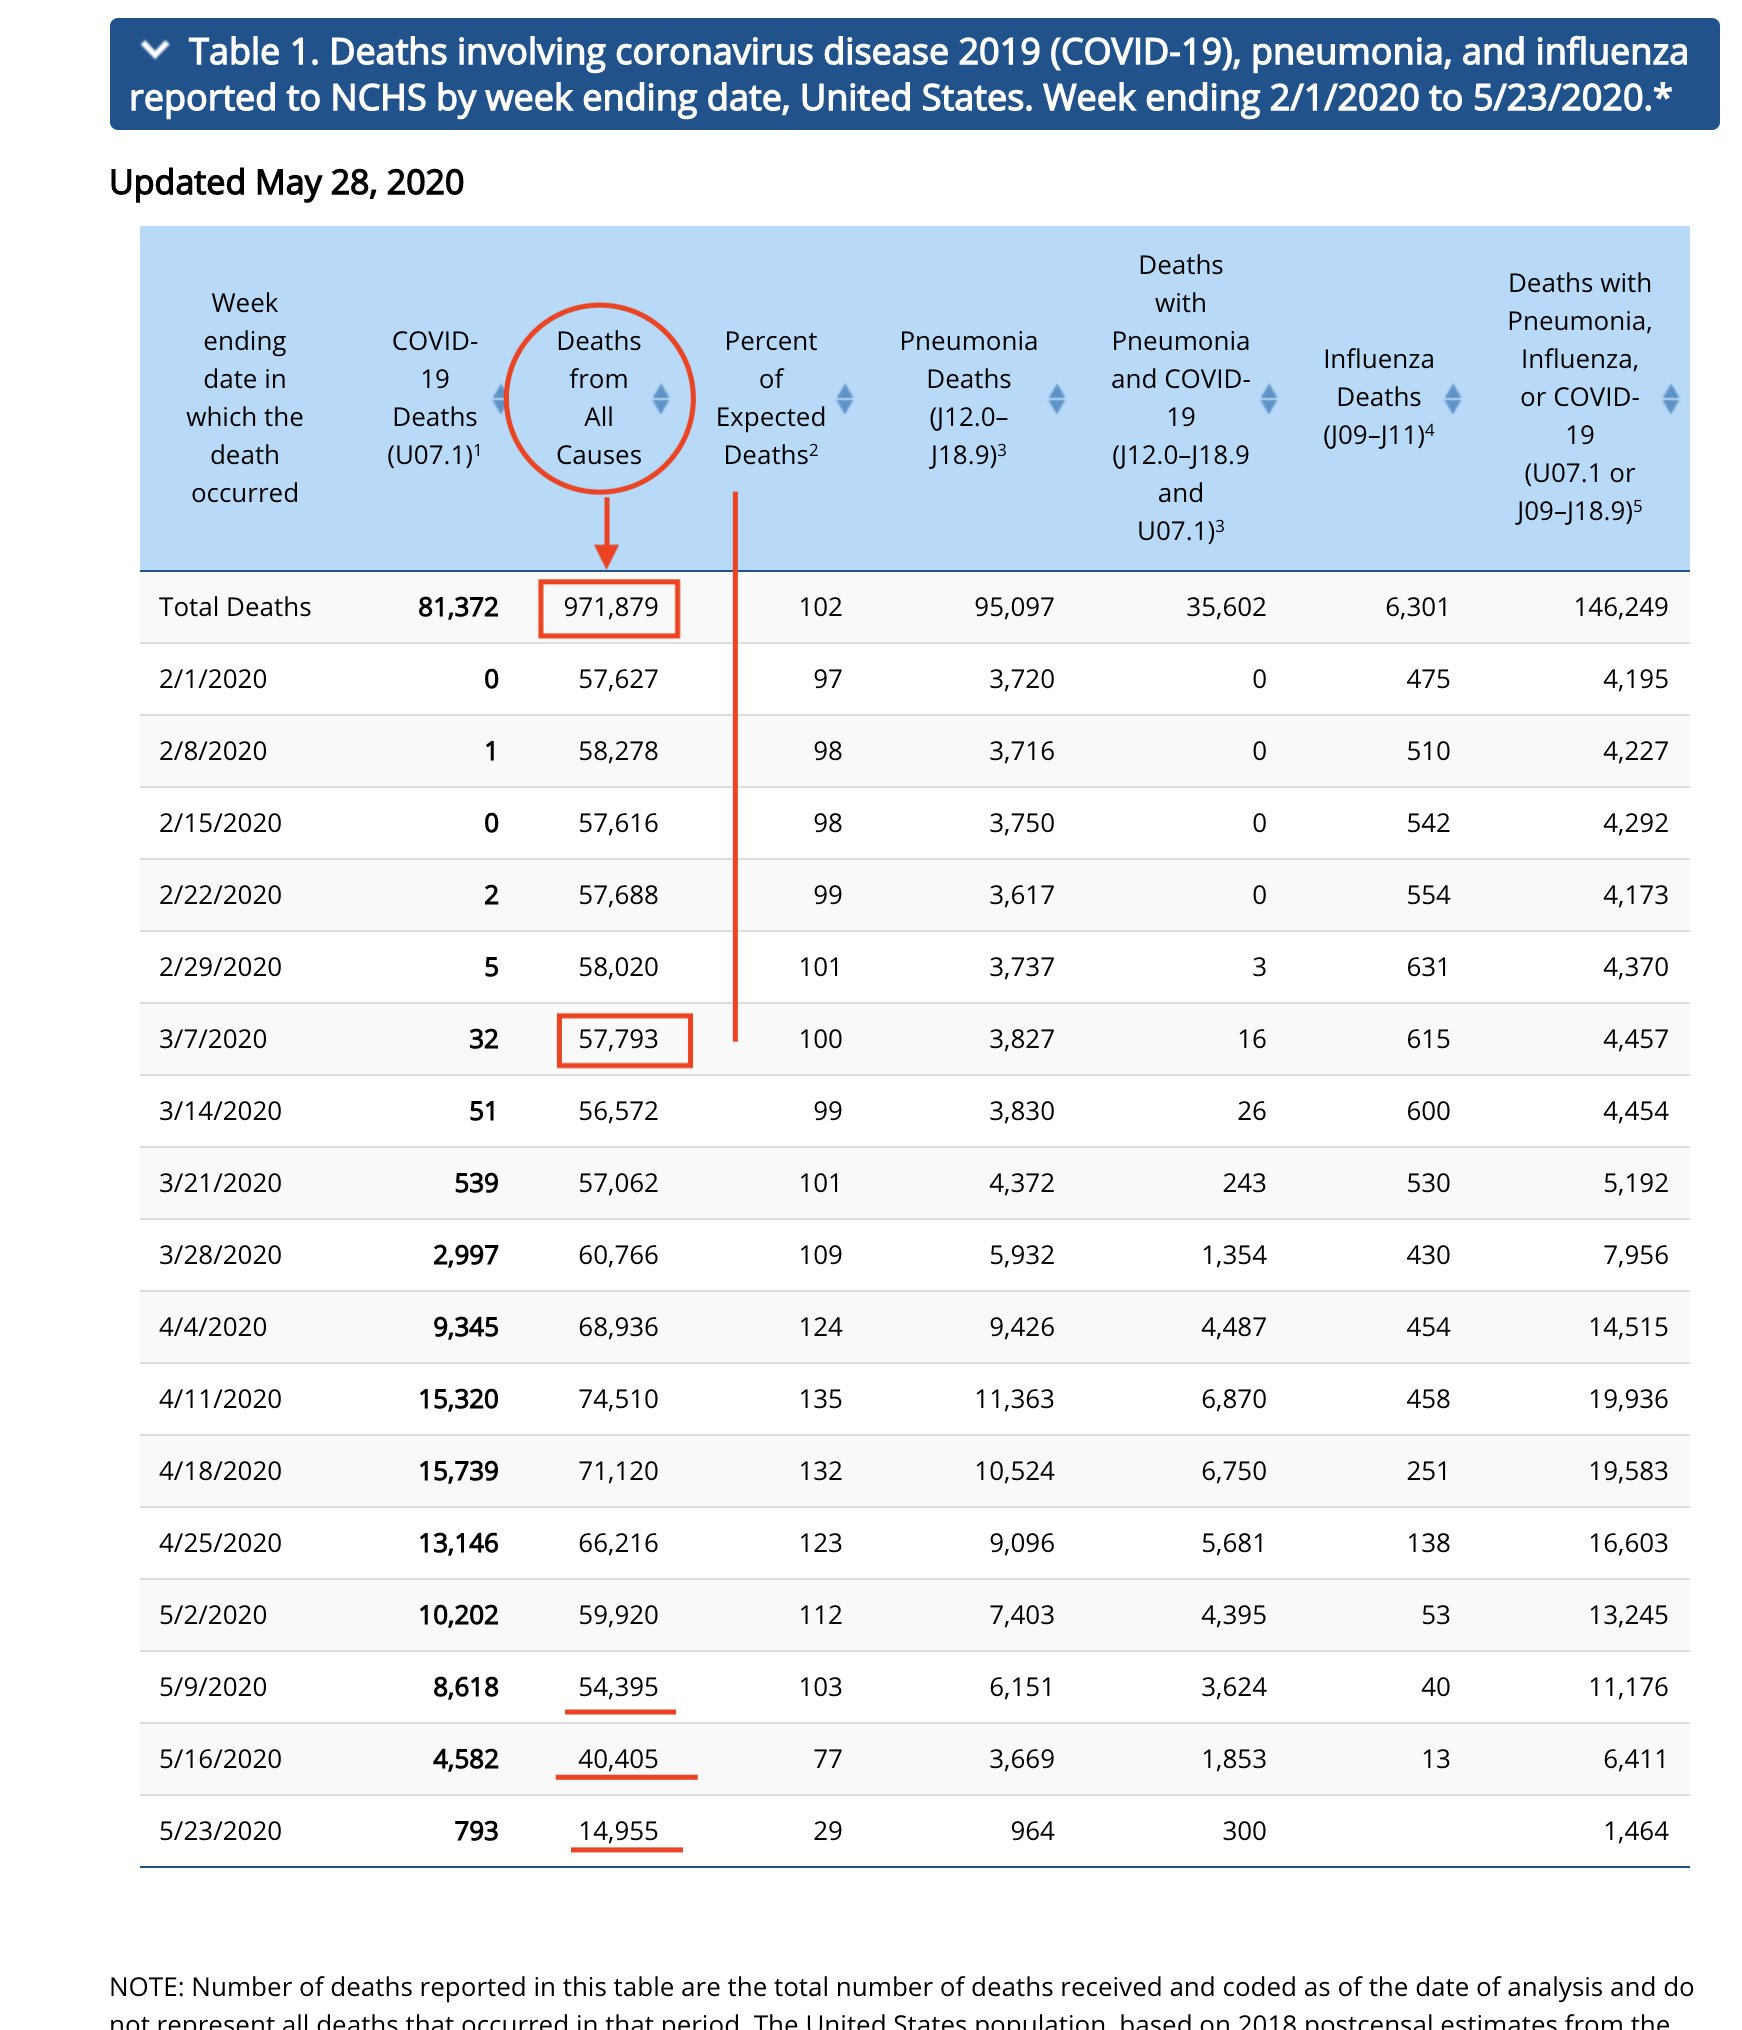
Well, the original Tweeter apparently didn't read this. Or he didn't crop out the evidence that debunked him very well. And I'm not sure 57,793 is actually the "normal" based off how 100% seems to vary throughout the chart, but it's close, I guess.
https://www.cdc.gov/nchs/nvss/vsrr/covid19/index.htm
NOTE: Number of deaths reported in this table are the total number of deaths received and coded as of the date of analysis and do not represent all deaths that occurred in that period. Counts of deaths occurring before or after the reporting period are not included in the table.
*Data during this period are incomplete because of the lag in time between when the death occurred and when the death certificate is completed, submitted to NCHS and processed for reporting purposes. This delay can range from 1 week to 8 weeks or more, depending on the jurisdiction and cause of death.
More current "Deaths From All Causes":
5/9 - 62,673
5/16 - 58,589
5/23 - 54,389
So yes, it was a shit conclusion, but those still aren't shutdown worthy numbers either. This isn't an exponential death rate.
“It is impossible to get a man to understand something if his livelihood depends on him not understanding.” -
No no no. I never said I "don't like" the data. The data is the data. It is the CDC's numbers.
I am saying the analysis and conclusion are bad/wrong.
How about this, maybe I jumped the gun. What do you think the conclusion is of the data and tweet JAFBAF posted above? What do you think the conclusion is?
Well, the original Tweeter apparently didn't read this. Or he didn't crop out the evidence that debunked him very well. And I'm not sure 57,793 is actually the "normal" based off how 100% seems to vary throughout the chart, but it's close, I guess.
https://www.cdc.gov/nchs/nvss/vsrr/covid19/index.htm
NOTE: Number of deaths reported in this table are the total number of deaths received and coded as of the date of analysis and do not represent all deaths that occurred in that period. Counts of deaths occurring before or after the reporting period are not included in the table.
*Data during this period are incomplete because of the lag in time between when the death occurred and when the death certificate is completed, submitted to NCHS and processed for reporting purposes. This delay can range from 1 week to 8 weeks or more, depending on the jurisdiction and cause of death.
More current "Deaths From All Causes":
5/9 - 62,673
5/16 - 58,589
5/23 - 54,389
So yes, it was a shit conclusion, but those still aren't shutdown worthy numbers either. This isn't an exponential death rate.
Well, the original Tweeter apparently didn't read this. Or he didn't crop out the evidence that debunked him very well. And I'm not sure 57,793 is actually the "normal" based off how 100% seems to vary throughout the chart, but it's close, I guess.
https://www.cdc.gov/nchs/nvss/vsrr/covid19/index.htm
NOTE: Number of deaths reported in this table are the total number of deaths received and coded as of the date of analysis and do not represent all deaths that occurred in that period. Counts of deaths occurring before or after the reporting period are not included in the table.
*Data during this period are incomplete because of the lag in time between when the death occurred and when the death certificate is completed, submitted to NCHS and processed for reporting purposes. This delay can range from 1 week to 8 weeks or more, depending on the jurisdiction and cause of death.
More current "Deaths From All Causes":
5/9 - 62,673
5/16 - 58,589
5/23 - 54,389
So yes, it was a shit conclusion, but those still aren't shutdown worthy numbers either. This isn't an exponential death rate.
Well those ARE shutdown numbers. The assumption would be the number of deaths of there was no shutdown would be higher. That was the whole flatten the curve thing. You can't look at those numbers and say they're not enough to warrant a shutdown because those numbers already reflect the shutdown.
That goes to the total death numbers too. I would absolutely expect them to be lower than normal because people die less from outside causes when they stay home. You aren't driving anywhere? Probably less deaths from car crashes then. Etc.
The other point I was bringing up before, in that original post, I'm not sure their method of estimating "normal" deaths of that time period is accurate. That assumes there's no seasonality to the number of deaths. I haven't looked at the data to confirm yet.
That isn't all directed at you htown but I wanted to post it all.
Also, to anyone else, I'm still curious I'm hearing what you think the conclusion is of the tweet above.
Ja.brill Peppers - Cleveland Brown OldBrownsFan, on 02 Jun 2017 - 5:09PM said: "No you are not the work of the devil but you are deceived by the devil." Who's got it better than us? Nooooobody! -
First you say you're sure the data can be found online.
The data is found but you don't like it.
The least you can do is find the data you like since you're sure it can be found.
No no no. I never said I "don't like" the data. The data is the data. It is the CDC's numbers.
I am saying the analysis and conclusion are bad/wrong.
How about this, maybe I jumped the gun. What do you think the conclusion is of the data and tweet JAFBAF posted above? What do you think the conclusion is?
No no no. I never said I "don't like" the data. The data is the data. It is the CDC's numbers.
I am saying the analysis and conclusion are bad/wrong.
How about this, maybe I jumped the gun. What do you think the conclusion is of the data and tweet JAFBAF posted above? What do you think the conclusion is?
I'm not going to delve into the numbers. I believe you know what you're talking about here.
-
Well, the original Tweeter apparently didn't read this. Or he didn't crop out the evidence that debunked him very well. And I'm not sure 57,793 is actually the "normal" based off how 100% seems to vary throughout the chart, but it's close, I guess.
https://www.cdc.gov/nchs/nvss/vsrr/covid19/index.htm
NOTE: Number of deaths reported in this table are the total number of deaths received and coded as of the date of analysis and do not represent all deaths that occurred in that period. Counts of deaths occurring before or after the reporting period are not included in the table.
*Data during this period are incomplete because of the lag in time between when the death occurred and when the death certificate is completed, submitted to NCHS and processed for reporting purposes. This delay can range from 1 week to 8 weeks or more, depending on the jurisdiction and cause of death.
More current "Deaths From All Causes":
5/9 - 62,673
5/16 - 58,589
5/23 - 54,389
So yes, it was a shit conclusion, but those still aren't shutdown worthy numbers either. This isn't an exponential death rate.
Well those ARE shutdown numbers. The assumption would be the number of deaths of there was no shutdown would be higher. That was the whole flatten the curve thing. You can't look at those numbers and say they're not enough to warrant a shutdown because those numbers already reflect the shutdown.
That goes to the total death numbers too. I would absolutely expect them to be lower than normal because people die less from outside causes when they stay home. You aren't driving anywhere? Probably less deaths from car crashes then. Etc.
The other point I was bringing up before, in that original post, I'm not sure their method of estimating "normal" deaths of that time period is accurate. That assumes there's no seasonality to the number of deaths. I haven't looked at the data to confirm yet.
That isn't all directed at you htown but I wanted to post it all.
Also, to anyone else, I'm still curious I'm hearing what you think the conclusion is of the tweet above.
Well those ARE shutdown numbers. The assumption would be the number of deaths of there was no shutdown would be higher. That was the whole flatten the curve thing. You can't look at those numbers and say they're not enough to warrant a shutdown because those numbers already reflect the shutdown.
That goes to the total death numbers too. I would absolutely expect them to be lower than normal because people die less from outside causes when they stay home. You aren't driving anywhere? Probably less deaths from car crashes then. Etc.
The other point I was bringing up before, in that original post, I'm not sure their method of estimating "normal" deaths of that time period is accurate. That assumes there's no seasonality to the number of deaths. I haven't looked at the data to confirm yet.
That isn't all directed at you htown but I wanted to post it all.
Also, to anyone else, I'm still curious I'm hearing what you think the conclusion is of the tweet above.
I don't think you made it to Table 2 in the link. You can't use a one size fits all approach with every state. Kansas and Idaho don't need to go into lockdown the same way as NYC or NJ might. It's unnecessary damage to the economy.
As I've said in another thread, Texas may have claimed to be in lockdown, but weren't strictly enforcing it on anyone other than businesses. And they've suffered little beyond their "normal" for doing so.
Maybe all the people who are skipping chemo and similar treatment because of the 'rona are dying from their underlying issues at a higher rate. And if that's the case, the lockdown is nearly pointless for most areas.
The lockdown method isn't a proven effective theory for you to be so unobjective about it to begin with. What data do you have that makes you think it would work as a whole? Deductive reasoning?
-
Well those ARE shutdown numbers. The assumption would be the number of deaths of there was no shutdown would be higher. That was the whole flatten the curve thing. You can't look at those numbers and say they're not enough to warrant a shutdown because those numbers already reflect the shutdown.
That goes to the total death numbers too. I would absolutely expect them to be lower than normal because people die less from outside causes when they stay home. You aren't driving anywhere? Probably less deaths from car crashes then. Etc.
The other point I was bringing up before, in that original post, I'm not sure their method of estimating "normal" deaths of that time period is accurate. That assumes there's no seasonality to the number of deaths. I haven't looked at the data to confirm yet.
That isn't all directed at you htown but I wanted to post it all.
Also, to anyone else, I'm still curious I'm hearing what you think the conclusion is of the tweet above.
I don't think you made it to Table 2 in the link. You can't use a one size fits all approach with every state. Kansas and Idaho don't need to go into lockdown the same way as NYC or NJ might. It's unnecessary damage to the economy.
As I've said in another thread, Texas may have claimed to be in lockdown, but weren't strictly enforcing it on anyone other than businesses. And they've suffered little beyond their "normal" for doing so.
Maybe all the people who are skipping chemo and similar treatment because of the 'rona are dying from their underlying issues at a higher rate. And if that's the case, the lockdown is nearly pointless for most areas.
The lockdown method isn't a proven effective theory for you to be so unobjective about it to begin with. What data do you have that makes you think it would work as a whole? Deductive reasoning?
I don't think you made it to Table 2 in the link. You can't use a one size fits all approach with every state. Kansas and Idaho don't need to go into lockdown the same way as NYC or NJ might. It's unnecessary damage to the economy.
As I've said in another thread, Texas may have claimed to be in lockdown, but weren't strictly enforcing it on anyone other than businesses. And they've suffered little beyond their "normal" for doing so.
Maybe all the people who are skipping chemo and similar treatment because of the 'rona are dying from their underlying issues at a higher rate. And if that's the case, the lockdown is nearly pointless for most areas.
The lockdown method isn't a proven effective theory for you to be so unobjective about it to begin with. What data do you have that makes you think it would work as a whole? Deductive reasoning?
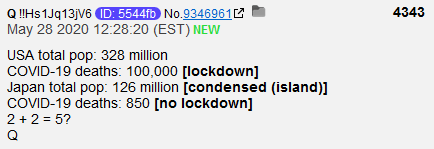
The best example I've seen is Sweden vs similar Scandinavian countries.
But yes, deductive reasoning plays a part too, as it's kind of hard to have a true control group in this case. I'd be interested in any research on the issue. But, logically, you'd expect less deaths and cases from a virus if you had less interaction between citizens.
You're right though, in your first paragraph. That analysis of deaths for all causes and the effect from Covid would probably vary by state. Now, each state isn't exactly living in a bubble so there should be some consideration taken for surrounding states (like in the gun laws debate), but it would be worth looking at them individually. Then on top of that, as I mentioned before, looking at the seasonality of the data.
Ja.brill Peppers - Cleveland Brown OldBrownsFan, on 02 Jun 2017 - 5:09PM said: "No you are not the work of the devil but you are deceived by the devil." Who's got it better than us? Nooooobody! -
No no no. I never said I "don't like" the data. The data is the data. It is the CDC's numbers.
I am saying the analysis and conclusion are bad/wrong.
How about this, maybe I jumped the gun. What do you think the conclusion is of the data and tweet JAFBAF posted above? What do you think the conclusion is?
I'm not going to delve into the numbers. I believe you know what you're talking about here.










Hello! It looks like you're interested in this conversation, but you don't have an account yet.
Getting fed up of having to scroll through the same posts each visit? When you register for an account, you'll always come back to exactly where you were before, and choose to be notified of new replies (either via email, or push notification). You'll also be able to save bookmarks and upvote posts to show your appreciation to other community members.
With your input, this post could be even better 💗
Register Login