
Gerrymandering arms race
-
Messed around with AI to get some actual data.
The important data is the last column, which shows the difference in % of republican held seats from the % of popular vote for that state. This number essentially shows you how badly each state is gerrymandered. The further from zero, the worse your state is. Negative numbers indicate Democrat favor and positive numbers indicate Republican favor. I've sorted the whole chart by most populous state. As you go lower in the chart, the data in the last column becomes less useful because the total number of house reps per state drops.
Of the states that have 10 or more house reps
- Virginia shows almost no difference between popular vote and house rep breakdown
- Illinois has the biggest difference
As a whole, the country sucks at minimizing the effect of gerrymandering.
2024 U.S. House Election Results and Presidential Popular Vote by State (Sorted by Population)
State
Population (2023 Est.)
Total House Seats
Democratic House Reps
Democratic % of State Seats
Republican House Reps
Republican % of State Seats
Democratic Vote % (Harris)
Republican Vote % (Trump)
Republican House % - Trump Vote %
California
38,965,193
52
40
76.92%
12
23.08%
58.47%
38.33%
-15.25%
Texas
30,503,301
38
13
34.21%
25
65.79%
42.46%
56.14%
9.65%
Florida
22,610,726
28
8
28.57%
20
71.43%
42.99%
56.09%
15.34%
New York
19,571,216
26
16
61.54%
10
38.46%
55.91%
43.31%
-4.85%
Pennsylvania
12,961,683
17
9
52.94%
8
47.06%
48.66%
50.37%
-3.31%
Illinois
12,549,689
17
14
82.35%
3
17.65%
54.37%
43.47%
-25.82%
Ohio
11,785,935
15
5
33.33%
10
66.67%
43.93%
55.14%
11.53%
Georgia
11,029,227
14
5
35.71%
9
64.29%
48.53%
50.73%
13.56%
North Carolina
10,835,491
14
7
50.00%
7
50.00%
47.65%
50.86%
-0.86%
Michigan
10,030,722
13
6
46.15%
7
53.85%
48.31%
49.73%
4.12%
New Jersey
9,290,841
12
9
75.00%
3
25.00%
51.97%
46.06%
-21.06%
Virginia
8,715,698
11
6
54.55%
5
45.45%
51.83%
46.05%
-0.60%
Washington
7,812,880
10
8
80.00%
2
20.00%
57.23%
39.01%
-19.01%
Arizona
7,431,344
9
3
33.33%
6
66.67%
46.69%
52.22%
14.45%
Tennessee
7,126,489
9
1
11.11%
8
88.89%
34.47%
64.19%
24.70%
Massachusetts
7,001,399
9
9
100.00%
0
0.00%
61.22%
36.02%
-36.02%
Indiana
6,862,199
9
2
22.22%
7
77.78%
39.62%
58.58%
19.20%
Missouri
6,196,156
8
2
25.00%
6
75.00%
40.08%
58.49%
16.51%
Maryland
6,180,253
8
7
87.50%
1
12.50%
62.62%
34.08%
-21.58%
Wisconsin
5,910,955
8
2
25.00%
6
75.00%
48.84%
49.70%
25.30%
Colorado
5,877,610
8
5
62.50%
3
37.50%
54.13%
43.14%
-5.64%
Minnesota
5,737,915
8
4
50.00%
4
50.00%
50.92%
46.68%
3.32%
South Carolina
5,373,555
7
1
14.29%
6
85.71%
40.36%
58.23%
27.48%
Alabama
5,108,468
7
1
14.29%
6
85.71%
34.10%
64.57%
21.14%
Louisiana
4,573,749
6
1
16.67%
5
83.33%
38.21%
60.22%
23.11%
Kentucky
4,526,332
6
1
16.67%
5
83.33%
33.94%
64.47%
18.86%
Oregon
4,233,358
6
4
66.67%
2
33.33%
55.27%
40.97%
-7.64%
Oklahoma
4,053,824
5
0
0.00%
5
100.00%
31.90%
66.16%
33.84%
Connecticut
3,617,176
5
5
100.00%
0
0.00%
56.40%
41.89%
-41.89%
Utah
3,417,734
4
0
0.00%
4
100.00%
37.79%
59.38%
40.62%
Iowa
3,207,004
4
0
0.00%
4
100.00%
42.52%
55.73%
44.27%
Nevada
3,194,176
4
3
75.00%
1
25.00%
47.49%
50.59%
-25.59%
Arkansas
3,067,732
4
0
0.00%
4
100.00%
33.56%
64.20%
35.80%
Mississippi
2,939,690
4
1
25.00%
3
75.00%
38.00%
60.89%
14.11%
Kansas
2,944,376
4
1
25.00%
3
75.00%
41.04%
57.16%
17.84%
New Mexico
2,114,371
3
3
100.00%
0
0.00%
51.85%
45.85%
-45.85%
Nebraska
1,978,379
3
0
0.00%
3
100.00%
39.06%
59.63%
40.37%
Idaho
1,964,374
2
0
0.00%
2
100.00%
30.39%
66.89%
33.11%
West Virginia
1,770,071
2
0
0.00%
2
100.00%
28.11%
69.98%
30.02%
Hawaii
1,435,138
2
2
100.00%
0
0.00%
60.59%
37.48%
-37.48%
New Hampshire
1,402,054
2
2
100.00%
0
0.00%
50.65%
47.87%
-47.87%
Maine
1,395,722
2
2
100.00%
0
0.00%
52.44%
45.50%
-45.50%
Montana
1,132,366
2
0
0.00%
2
100.00%
38.46%
58.39%
41.61%
Rhode Island
1,095,962
2
2
100.00%
0
0.00%
55.54%
41.76%
-41.76%
Delaware
1,030,132
1
1
100.00%
0
0.00%
56.63%
41.89%
-41.89%
South Dakota
919,318
1
0
0.00%
1
100.00%
34.24%
63.43%
36.57%
North Dakota
783,926
1
0
0.00%
1
100.00%
30.51%
66.96%
33.04%
Vermont
647,464
1
1
100.00%
0
0.00%
63.83%
32.32%
-32.32%
Wyoming
586,485
1
0
0.00%
1
100.00%
25.84%
71.60%
28.40%
Total
331,589,273
435
215
49.43%
220
50.57%
48.3%
49.8%
0.77%
-
Messed around with AI to get some actual data.
The important data is the last column, which shows the difference in % of republican held seats from the % of popular vote for that state. This number essentially shows you how badly each state is gerrymandered. The further from zero, the worse your state is. Negative numbers indicate Democrat favor and positive numbers indicate Republican favor. I've sorted the whole chart by most populous state. As you go lower in the chart, the data in the last column becomes less useful because the total number of house reps per state drops.
Of the states that have 10 or more house reps
- Virginia shows almost no difference between popular vote and house rep breakdown
- Illinois has the biggest difference
As a whole, the country sucks at minimizing the effect of gerrymandering.
2024 U.S. House Election Results and Presidential Popular Vote by State (Sorted by Population)
State
Population (2023 Est.)
Total House Seats
Democratic House Reps
Democratic % of State Seats
Republican House Reps
Republican % of State Seats
Democratic Vote % (Harris)
Republican Vote % (Trump)
Republican House % - Trump Vote %
California
38,965,193
52
40
76.92%
12
23.08%
58.47%
38.33%
-15.25%
Texas
30,503,301
38
13
34.21%
25
65.79%
42.46%
56.14%
9.65%
Florida
22,610,726
28
8
28.57%
20
71.43%
42.99%
56.09%
15.34%
New York
19,571,216
26
16
61.54%
10
38.46%
55.91%
43.31%
-4.85%
Pennsylvania
12,961,683
17
9
52.94%
8
47.06%
48.66%
50.37%
-3.31%
Illinois
12,549,689
17
14
82.35%
3
17.65%
54.37%
43.47%
-25.82%
Ohio
11,785,935
15
5
33.33%
10
66.67%
43.93%
55.14%
11.53%
Georgia
11,029,227
14
5
35.71%
9
64.29%
48.53%
50.73%
13.56%
North Carolina
10,835,491
14
7
50.00%
7
50.00%
47.65%
50.86%
-0.86%
Michigan
10,030,722
13
6
46.15%
7
53.85%
48.31%
49.73%
4.12%
New Jersey
9,290,841
12
9
75.00%
3
25.00%
51.97%
46.06%
-21.06%
Virginia
8,715,698
11
6
54.55%
5
45.45%
51.83%
46.05%
-0.60%
Washington
7,812,880
10
8
80.00%
2
20.00%
57.23%
39.01%
-19.01%
Arizona
7,431,344
9
3
33.33%
6
66.67%
46.69%
52.22%
14.45%
Tennessee
7,126,489
9
1
11.11%
8
88.89%
34.47%
64.19%
24.70%
Massachusetts
7,001,399
9
9
100.00%
0
0.00%
61.22%
36.02%
-36.02%
Indiana
6,862,199
9
2
22.22%
7
77.78%
39.62%
58.58%
19.20%
Missouri
6,196,156
8
2
25.00%
6
75.00%
40.08%
58.49%
16.51%
Maryland
6,180,253
8
7
87.50%
1
12.50%
62.62%
34.08%
-21.58%
Wisconsin
5,910,955
8
2
25.00%
6
75.00%
48.84%
49.70%
25.30%
Colorado
5,877,610
8
5
62.50%
3
37.50%
54.13%
43.14%
-5.64%
Minnesota
5,737,915
8
4
50.00%
4
50.00%
50.92%
46.68%
3.32%
South Carolina
5,373,555
7
1
14.29%
6
85.71%
40.36%
58.23%
27.48%
Alabama
5,108,468
7
1
14.29%
6
85.71%
34.10%
64.57%
21.14%
Louisiana
4,573,749
6
1
16.67%
5
83.33%
38.21%
60.22%
23.11%
Kentucky
4,526,332
6
1
16.67%
5
83.33%
33.94%
64.47%
18.86%
Oregon
4,233,358
6
4
66.67%
2
33.33%
55.27%
40.97%
-7.64%
Oklahoma
4,053,824
5
0
0.00%
5
100.00%
31.90%
66.16%
33.84%
Connecticut
3,617,176
5
5
100.00%
0
0.00%
56.40%
41.89%
-41.89%
Utah
3,417,734
4
0
0.00%
4
100.00%
37.79%
59.38%
40.62%
Iowa
3,207,004
4
0
0.00%
4
100.00%
42.52%
55.73%
44.27%
Nevada
3,194,176
4
3
75.00%
1
25.00%
47.49%
50.59%
-25.59%
Arkansas
3,067,732
4
0
0.00%
4
100.00%
33.56%
64.20%
35.80%
Mississippi
2,939,690
4
1
25.00%
3
75.00%
38.00%
60.89%
14.11%
Kansas
2,944,376
4
1
25.00%
3
75.00%
41.04%
57.16%
17.84%
New Mexico
2,114,371
3
3
100.00%
0
0.00%
51.85%
45.85%
-45.85%
Nebraska
1,978,379
3
0
0.00%
3
100.00%
39.06%
59.63%
40.37%
Idaho
1,964,374
2
0
0.00%
2
100.00%
30.39%
66.89%
33.11%
West Virginia
1,770,071
2
0
0.00%
2
100.00%
28.11%
69.98%
30.02%
Hawaii
1,435,138
2
2
100.00%
0
0.00%
60.59%
37.48%
-37.48%
New Hampshire
1,402,054
2
2
100.00%
0
0.00%
50.65%
47.87%
-47.87%
Maine
1,395,722
2
2
100.00%
0
0.00%
52.44%
45.50%
-45.50%
Montana
1,132,366
2
0
0.00%
2
100.00%
38.46%
58.39%
41.61%
Rhode Island
1,095,962
2
2
100.00%
0
0.00%
55.54%
41.76%
-41.76%
Delaware
1,030,132
1
1
100.00%
0
0.00%
56.63%
41.89%
-41.89%
South Dakota
919,318
1
0
0.00%
1
100.00%
34.24%
63.43%
36.57%
North Dakota
783,926
1
0
0.00%
1
100.00%
30.51%
66.96%
33.04%
Vermont
647,464
1
1
100.00%
0
0.00%
63.83%
32.32%
-32.32%
Wyoming
586,485
1
0
0.00%
1
100.00%
25.84%
71.60%
28.40%
Total
331,589,273
435
215
49.43%
220
50.57%
48.3%
49.8%
0.77%
Messed around with AI to get some actual data.
The important data is the last column, which shows the difference in % of republican held seats from the % of popular vote for that state. This number essentially shows you how badly each state is gerrymandered. I've sorted the whole chart by most populous state. As you go lower in the chart, the data in the last column becomes less useful because the total number of house reps per state drops.
Of the states that have 10 or more house reps
- Virginia shows almost no difference between popular vote and house rep breakdown
- Illinois has the biggest difference
As a whole, the country sucks at minimizing the effect of gerrymandering.
2024 U.S. House Election Results and Presidential Popular Vote by State (Sorted by Population)
State
Population (2023 Est.)
Total House Seats
Democratic House Reps
Democratic % of State Seats
Republican House Reps
Republican % of State Seats
Democratic Vote % (Harris)
Republican Vote % (Trump)
Republican House % - Trump Vote %
California
38,965,193
52
40
76.92%
12
23.08%
58.47%
38.33%
-15.25%
Texas
30,503,301
38
13
34.21%
25
65.79%
42.46%
56.14%
9.65%
Florida
22,610,726
28
8
28.57%
20
71.43%
42.99%
56.09%
15.34%
New York
19,571,216
26
16
61.54%
10
38.46%
55.91%
43.31%
-4.85%
Pennsylvania
12,961,683
17
9
52.94%
8
47.06%
48.66%
50.37%
-3.31%
Illinois
12,549,689
17
14
82.35%
3
17.65%
54.37%
43.47%
-25.82%
Ohio
11,785,935
15
5
33.33%
10
66.67%
43.93%
55.14%
11.53%
Georgia
11,029,227
14
5
35.71%
9
64.29%
48.53%
50.73%
13.56%
North Carolina
10,835,491
14
7
50.00%
7
50.00%
47.65%
50.86%
-0.86%
Michigan
10,030,722
13
6
46.15%
7
53.85%
48.31%
49.73%
4.12%
New Jersey
9,290,841
12
9
75.00%
3
25.00%
51.97%
46.06%
-21.06%
Virginia
8,715,698
11
6
54.55%
5
45.45%
51.83%
46.05%
-0.60%
Washington
7,812,880
10
8
80.00%
2
20.00%
57.23%
39.01%
-19.01%
Arizona
7,431,344
9
3
33.33%
6
66.67%
46.69%
52.22%
14.45%
Tennessee
7,126,489
9
1
11.11%
8
88.89%
34.47%
64.19%
24.70%
Massachusetts
7,001,399
9
9
100.00%
0
0.00%
61.22%
36.02%
-36.02%
Indiana
6,862,199
9
2
22.22%
7
77.78%
39.62%
58.58%
19.20%
Missouri
6,196,156
8
2
25.00%
6
75.00%
40.08%
58.49%
16.51%
Maryland
6,180,253
8
7
87.50%
1
12.50%
62.62%
34.08%
-21.58%
Wisconsin
5,910,955
8
2
25.00%
6
75.00%
48.84%
49.70%
25.30%
Colorado
5,877,610
8
5
62.50%
3
37.50%
54.13%
43.14%
-5.64%
Minnesota
5,737,915
8
4
50.00%
4
50.00%
50.92%
46.68%
3.32%
South Carolina
5,373,555
7
1
14.29%
6
85.71%
40.36%
58.23%
27.48%
Alabama
5,108,468
7
1
14.29%
6
85.71%
34.10%
64.57%
21.14%
Louisiana
4,573,749
6
1
16.67%
5
83.33%
38.21%
60.22%
23.11%
Kentucky
4,526,332
6
1
16.67%
5
83.33%
33.94%
64.47%
18.86%
Oregon
4,233,358
6
4
66.67%
2
33.33%
55.27%
40.97%
-7.64%
Oklahoma
4,053,824
5
0
0.00%
5
100.00%
31.90%
66.16%
33.84%
Connecticut
3,617,176
5
5
100.00%
0
0.00%
56.40%
41.89%
-41.89%
Utah
3,417,734
4
0
0.00%
4
100.00%
37.79%
59.38%
40.62%
Iowa
3,207,004
4
0
0.00%
4
100.00%
42.52%
55.73%
44.27%
Nevada
3,194,176
4
3
75.00%
1
25.00%
47.49%
50.59%
-25.59%
Arkansas
3,067,732
4
0
0.00%
4
100.00%
33.56%
64.20%
35.80%
Mississippi
2,939,690
4
1
25.00%
3
75.00%
38.00%
60.89%
14.11%
Kansas
2,944,376
4
1
25.00%
3
75.00%
41.04%
57.16%
17.84%
New Mexico
2,114,371
3
3
100.00%
0
0.00%
51.85%
45.85%
-45.85%
Nebraska
1,978,379
3
0
0.00%
3
100.00%
39.06%
59.63%
40.37%
Idaho
1,964,374
2
0
0.00%
2
100.00%
30.39%
66.89%
33.11%
West Virginia
1,770,071
2
0
0.00%
2
100.00%
28.11%
69.98%
30.02%
Hawaii
1,435,138
2
2
100.00%
0
0.00%
60.59%
37.48%
-37.48%
New Hampshire
1,402,054
2
2
100.00%
0
0.00%
50.65%
47.87%
-47.87%
Maine
1,395,722
2
2
100.00%
0
0.00%
52.44%
45.50%
-45.50%
Montana
1,132,366
2
0
0.00%
2
100.00%
38.46%
58.39%
41.61%
Rhode Island
1,095,962
2
2
100.00%
0
0.00%
55.54%
41.76%
-41.76%
Delaware
1,030,132
1
1
100.00%
0
0.00%
56.63%
41.89%
-41.89%
South Dakota
919,318
1
0
0.00%
1
100.00%
34.24%
63.43%
36.57%
North Dakota
783,926
1
0
0.00%
1
100.00%
30.51%
66.96%
33.04%
Vermont
647,464
1
1
100.00%
0
0.00%
63.83%
32.32%
-32.32%
Wyoming
586,485
1
0
0.00%
1
100.00%
25.84%
71.60%
28.40%
Total
331,589,273
435
215
49.43%
220
50.57%
48.3%
49.8%
0.77%
I'd think you'd have to take into account the likelihood of a registered Dem vs a registered Rep to vote.
It's also only based on actual party registration, not political leanings. Obviously the data can't be perfect though. --- read it wrong, that's not how the data is set up
You could try comparing it to how the state voted in the presidential election. --- nevermind, I see that's how it was setup now. Unfortunately that would add the voter turnout element.
Or how they voted for senators. But that's not perfect either.
Interesting though. But I am still hesitant to just use AI gathered data
Ja.brill Peppers - Cleveland Brown OldBrownsFan, on 02 Jun 2017 - 5:09PM said: "No you are not the work of the devil but you are deceived by the devil." Who's got it better than us? Nooooobody! -
Messed around with AI to get some actual data.
The important data is the last column, which shows the difference in % of republican held seats from the % of popular vote for that state. This number essentially shows you how badly each state is gerrymandered. I've sorted the whole chart by most populous state. As you go lower in the chart, the data in the last column becomes less useful because the total number of house reps per state drops.
Of the states that have 10 or more house reps
- Virginia shows almost no difference between popular vote and house rep breakdown
- Illinois has the biggest difference
As a whole, the country sucks at minimizing the effect of gerrymandering.
2024 U.S. House Election Results and Presidential Popular Vote by State (Sorted by Population)
State
Population (2023 Est.)
Total House Seats
Democratic House Reps
Democratic % of State Seats
Republican House Reps
Republican % of State Seats
Democratic Vote % (Harris)
Republican Vote % (Trump)
Republican House % - Trump Vote %
California
38,965,193
52
40
76.92%
12
23.08%
58.47%
38.33%
-15.25%
Texas
30,503,301
38
13
34.21%
25
65.79%
42.46%
56.14%
9.65%
Florida
22,610,726
28
8
28.57%
20
71.43%
42.99%
56.09%
15.34%
New York
19,571,216
26
16
61.54%
10
38.46%
55.91%
43.31%
-4.85%
Pennsylvania
12,961,683
17
9
52.94%
8
47.06%
48.66%
50.37%
-3.31%
Illinois
12,549,689
17
14
82.35%
3
17.65%
54.37%
43.47%
-25.82%
Ohio
11,785,935
15
5
33.33%
10
66.67%
43.93%
55.14%
11.53%
Georgia
11,029,227
14
5
35.71%
9
64.29%
48.53%
50.73%
13.56%
North Carolina
10,835,491
14
7
50.00%
7
50.00%
47.65%
50.86%
-0.86%
Michigan
10,030,722
13
6
46.15%
7
53.85%
48.31%
49.73%
4.12%
New Jersey
9,290,841
12
9
75.00%
3
25.00%
51.97%
46.06%
-21.06%
Virginia
8,715,698
11
6
54.55%
5
45.45%
51.83%
46.05%
-0.60%
Washington
7,812,880
10
8
80.00%
2
20.00%
57.23%
39.01%
-19.01%
Arizona
7,431,344
9
3
33.33%
6
66.67%
46.69%
52.22%
14.45%
Tennessee
7,126,489
9
1
11.11%
8
88.89%
34.47%
64.19%
24.70%
Massachusetts
7,001,399
9
9
100.00%
0
0.00%
61.22%
36.02%
-36.02%
Indiana
6,862,199
9
2
22.22%
7
77.78%
39.62%
58.58%
19.20%
Missouri
6,196,156
8
2
25.00%
6
75.00%
40.08%
58.49%
16.51%
Maryland
6,180,253
8
7
87.50%
1
12.50%
62.62%
34.08%
-21.58%
Wisconsin
5,910,955
8
2
25.00%
6
75.00%
48.84%
49.70%
25.30%
Colorado
5,877,610
8
5
62.50%
3
37.50%
54.13%
43.14%
-5.64%
Minnesota
5,737,915
8
4
50.00%
4
50.00%
50.92%
46.68%
3.32%
South Carolina
5,373,555
7
1
14.29%
6
85.71%
40.36%
58.23%
27.48%
Alabama
5,108,468
7
1
14.29%
6
85.71%
34.10%
64.57%
21.14%
Louisiana
4,573,749
6
1
16.67%
5
83.33%
38.21%
60.22%
23.11%
Kentucky
4,526,332
6
1
16.67%
5
83.33%
33.94%
64.47%
18.86%
Oregon
4,233,358
6
4
66.67%
2
33.33%
55.27%
40.97%
-7.64%
Oklahoma
4,053,824
5
0
0.00%
5
100.00%
31.90%
66.16%
33.84%
Connecticut
3,617,176
5
5
100.00%
0
0.00%
56.40%
41.89%
-41.89%
Utah
3,417,734
4
0
0.00%
4
100.00%
37.79%
59.38%
40.62%
Iowa
3,207,004
4
0
0.00%
4
100.00%
42.52%
55.73%
44.27%
Nevada
3,194,176
4
3
75.00%
1
25.00%
47.49%
50.59%
-25.59%
Arkansas
3,067,732
4
0
0.00%
4
100.00%
33.56%
64.20%
35.80%
Mississippi
2,939,690
4
1
25.00%
3
75.00%
38.00%
60.89%
14.11%
Kansas
2,944,376
4
1
25.00%
3
75.00%
41.04%
57.16%
17.84%
New Mexico
2,114,371
3
3
100.00%
0
0.00%
51.85%
45.85%
-45.85%
Nebraska
1,978,379
3
0
0.00%
3
100.00%
39.06%
59.63%
40.37%
Idaho
1,964,374
2
0
0.00%
2
100.00%
30.39%
66.89%
33.11%
West Virginia
1,770,071
2
0
0.00%
2
100.00%
28.11%
69.98%
30.02%
Hawaii
1,435,138
2
2
100.00%
0
0.00%
60.59%
37.48%
-37.48%
New Hampshire
1,402,054
2
2
100.00%
0
0.00%
50.65%
47.87%
-47.87%
Maine
1,395,722
2
2
100.00%
0
0.00%
52.44%
45.50%
-45.50%
Montana
1,132,366
2
0
0.00%
2
100.00%
38.46%
58.39%
41.61%
Rhode Island
1,095,962
2
2
100.00%
0
0.00%
55.54%
41.76%
-41.76%
Delaware
1,030,132
1
1
100.00%
0
0.00%
56.63%
41.89%
-41.89%
South Dakota
919,318
1
0
0.00%
1
100.00%
34.24%
63.43%
36.57%
North Dakota
783,926
1
0
0.00%
1
100.00%
30.51%
66.96%
33.04%
Vermont
647,464
1
1
100.00%
0
0.00%
63.83%
32.32%
-32.32%
Wyoming
586,485
1
0
0.00%
1
100.00%
25.84%
71.60%
28.40%
Total
331,589,273
435
215
49.43%
220
50.57%
48.3%
49.8%
0.77%
I'd think you'd have to take into account the likelihood of a registered Dem vs a registered Rep to vote.
It's also only based on actual party registration, not political leanings. Obviously the data can't be perfect though. --- read it wrong, that's not how the data is set up
You could try comparing it to how the state voted in the presidential election. --- nevermind, I see that's how it was setup now. Unfortunately that would add the voter turnout element.
Or how they voted for senators. But that's not perfect either.
Interesting though. But I am still hesitant to just use AI gathered data
But I am still hesitant to just use AI gathered data
It's actually really damn good at parsing raw data. For now, I draw the line at letting AI interpret the data, it's still susceptible to unknown biases. But when I need to find an exact Medicare guideline for them to cover a specific service, I let AI find what I need and verify.
-
But I am still hesitant to just use AI gathered data
It's actually really damn good at parsing raw data. For now, I draw the line at letting AI interpret the data, it's still susceptible to unknown biases. But when I need to find an exact Medicare guideline for them to cover a specific service, I let AI find what I need and verify.
It's actually really damn good at parsing raw data. For now, I draw the line at letting AI interpret the data, it's still susceptible to unknown biases. But when I need to find an exact Medicare guideline for them to cover a specific service, I let AI find what I need and verify.
Well, I have no complaint with a I, and yes, I know. It doesn't know the difference between bullshit and straight up once in a while. But on the other hand it's not actively twisted toward left or right. Like google.
Of course, it's always funny to see people switch hats on gerrymandering, depending on whose side benefits.
WSS
www.westsidesteve.com www.myspace.com/westsidestevemusic www.cdbaby.com/artist/westsidestevesimmons -
-
guns don't kill kids-pitt bulls do.
-
But I am still hesitant to just use AI gathered data
It's actually really damn good at parsing raw data. For now, I draw the line at letting AI interpret the data, it's still susceptible to unknown biases. But when I need to find an exact Medicare guideline for them to cover a specific service, I let AI find what I need and verify.
It's actually really damn good at parsing raw data. For now, I draw the line at letting AI interpret the data, it's still susceptible to unknown biases. But when I need to find an exact Medicare guideline for them to cover a specific service, I let AI find what I need and verify.
I absolutely would not implicitly trust whatever data it spits out. At most I use it now as an advanced Wikipedia, making sure to ask for sources, and then directly checking each source.
Find, don't trust, and verify
I'm very concerned about students coming through school now with the crutch of AI. This probably sounds like older generations complaining about calculators, but those calculators didn't do the thinking for you. I'm in the consulting world and I'm seeing it with the analysts right out of school excessively relying on AI.
It's a weird situation too, because their jobs are going to be on the chopping block for AI when more sr consultants can handle client relationships, speak as experts, and do the conceptual problem solving. An AI can spit out pages and Excel models. But, if you let an AI replace these entry level roles you don't have a base to grow into leadership.
Ja.brill Peppers - Cleveland Brown OldBrownsFan, on 02 Jun 2017 - 5:09PM said: "No you are not the work of the devil but you are deceived by the devil." Who's got it better than us? Nooooobody! -
It's actually really damn good at parsing raw data. For now, I draw the line at letting AI interpret the data, it's still susceptible to unknown biases. But when I need to find an exact Medicare guideline for them to cover a specific service, I let AI find what I need and verify.
Well, I have no complaint with a I, and yes, I know. It doesn't know the difference between bullshit and straight up once in a while. But on the other hand it's not actively twisted toward left or right. Like google.
Of course, it's always funny to see people switch hats on gerrymandering, depending on whose side benefits.
WSS
Well, I have no complaint with a I, and yes, I know. It doesn't know the difference between bullshit and straight up once in a while. But on the other hand it's not actively twisted toward left or right. Like google.
Of course, it's always funny to see people switch hats on gerrymandering, depending on whose side benefits.
WSS
Depending on the AI you're using it can easily spit out biased responses. Musk's AI is a documented example of this. I would trust any of them implicitly.
I agree, people should stay firm in their political ideological convictions. That's something not seen on this board though, and that's very clear based on those following MAGA over their supposed conservative principles.
I oppose all gerrymandering and think all redistricting should be done by a completely independent board at the same frequency of he census.
-
It's actually really damn good at parsing raw data. For now, I draw the line at letting AI interpret the data, it's still susceptible to unknown biases. But when I need to find an exact Medicare guideline for them to cover a specific service, I let AI find what I need and verify.
I absolutely would not implicitly trust whatever data it spits out. At most I use it now as an advanced Wikipedia, making sure to ask for sources, and then directly checking each source.
Find, don't trust, and verify
I'm very concerned about students coming through school now with the crutch of AI. This probably sounds like older generations complaining about calculators, but those calculators didn't do the thinking for you. I'm in the consulting world and I'm seeing it with the analysts right out of school excessively relying on AI.
It's a weird situation too, because their jobs are going to be on the chopping block for AI when more sr consultants can handle client relationships, speak as experts, and do the conceptual problem solving. An AI can spit out pages and Excel models. But, if you let an AI replace these entry level roles you don't have a base to grow into leadership.
I absolutely would not implicitly trust whatever data it spits out. At most I use it now as an advanced Wikipedia, making sure to ask for sources, and then directly checking each source.
Find, don't trust, and verify
I'm very concerned about students coming through school now with the crutch of AI. This probably sounds like older generations complaining about calculators, but those calculators didn't do the thinking for you. I'm in the consulting world and I'm seeing it with the analysts right out of school excessively relying on AI.
It's a weird situation too, because their jobs are going to be on the chopping block for AI when more sr consultants can handle client relationships, speak as experts, and do the conceptual problem solving. An AI can spit out pages and Excel models. But, if you let an AI replace these entry level roles you don't have a base to grow into leadership.
It's going to be hilarious seeing all these boomers hiring zoomers who are comfortable with AI, but don't bother to verify. A bunch of them are going to see initially passable results, fire all the competent people they don't want to pay, and then be left with zoomie and AI who have no idea what the fuck they're doing. I have already seen a bunch of viral linkedin posts of boomer bosses touting the first half of this scenario.
-
I absolutely would not implicitly trust whatever data it spits out. At most I use it now as an advanced Wikipedia, making sure to ask for sources, and then directly checking each source.
Find, don't trust, and verify
I'm very concerned about students coming through school now with the crutch of AI. This probably sounds like older generations complaining about calculators, but those calculators didn't do the thinking for you. I'm in the consulting world and I'm seeing it with the analysts right out of school excessively relying on AI.
It's a weird situation too, because their jobs are going to be on the chopping block for AI when more sr consultants can handle client relationships, speak as experts, and do the conceptual problem solving. An AI can spit out pages and Excel models. But, if you let an AI replace these entry level roles you don't have a base to grow into leadership.
It's going to be hilarious seeing all these boomers hiring zoomers who are comfortable with AI, but don't bother to verify. A bunch of them are going to see initially passable results, fire all the competent people they don't want to pay, and then be left with zoomie and AI who have no idea what the fuck they're doing. I have already seen a bunch of viral linkedin posts of boomer bosses touting the first half of this scenario.
It's going to be hilarious seeing all these boomers hiring zoomers who are comfortable with AI, but don't bother to verify. A bunch of them are going to see initially passable results, fire all the competent people they don't want to pay, and then be left with zoomie and AI who have no idea what the fuck they're doing. I have already seen a bunch of viral linkedin posts of boomer bosses touting the first half of this scenario.
I agree with you here completely. Companies will chase shareholder value by implementing AI and cutting entry level jobs. They'll get that short term boost.
But long term that's a gap in developing and investing in their future managers and leaders.
I've seen plenty of early college analysts absolutely crank out work in excel, great models, etc., and then have no idea what the numbers actually mean. AI is only going to make that worse.
-
-
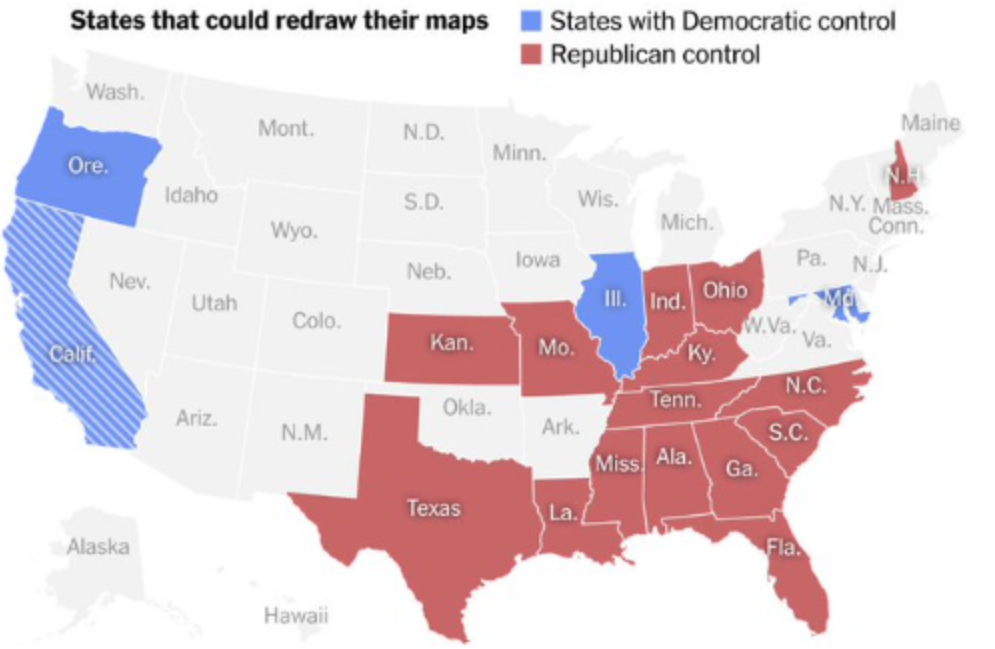
Tough to see how getting into this race is a good idea if you're DNC leadership.
-
Tough to see how getting into this race is a good idea if you're DNC leadership.
Tough to see how getting into this race is a good idea if you're DNC leadership.
I don't think they really have a choice. Trump ordered Texas to find more seats, and they did, redistricting norms be damned. I'm sure the party will continue to find ways to stack the deck mid census cycle.
Dems either do nothing, and massively fall behind, or they do something and fall behind less.
Reps are playing by their own set of rules and Dems need to wake up to that and fully suit. Or we'll just see more stacking the deck by stretching what's possible in favors of conservatives (gerrymandering, vote suppression, etc)
Ja.brill Peppers - Cleveland Brown OldBrownsFan, on 02 Jun 2017 - 5:09PM said: "No you are not the work of the devil but you are deceived by the devil." Who's got it better than us? Nooooobody! -
Tough to see how getting into this race is a good idea if you're DNC leadership.
I don't think they really have a choice. Trump ordered Texas to find more seats, and they did, redistricting norms be damned. I'm sure the party will continue to find ways to stack the deck mid census cycle.
Dems either do nothing, and massively fall behind, or they do something and fall behind less.
Reps are playing by their own set of rules and Dems need to wake up to that and fully suit. Or we'll just see more stacking the deck by stretching what's possible in favors of conservatives (gerrymandering, vote suppression, etc)
***FART FART FART***********
Stinking up the forum AGAIN ?
The left/dems shafted republicans in Texas, and are famous for doing the same in California, etc.
fixing it is what is fair.

-
Tough to see how getting into this race is a good idea if you're DNC leadership.
I don't think they really have a choice. Trump ordered Texas to find more seats, and they did, redistricting norms be damned. I'm sure the party will continue to find ways to stack the deck mid census cycle.
Dems either do nothing, and massively fall behind, or they do something and fall behind less.
Reps are playing by their own set of rules and Dems need to wake up to that and fully suit. Or we'll just see more stacking the deck by stretching what's possible in favors of conservatives (gerrymandering, vote suppression, etc)
I don't think they really have a choice. Trump ordered Texas to find more seats, and they did, redistricting norms be damned. I'm sure the party will continue to find ways to stack the deck mid census cycle.
Dems either do nothing, and massively fall behind, or they do something and fall behind less.
Reps are playing by their own set of rules and Dems need to wake up to that and fully suit. Or we'll just see more stacking the deck by stretching what's possible in favors of conservatives (gerrymandering, vote suppression, etc)
Dems do nothing? Are you fucking serious? They wrote the book on gerrymandering.
-
Nothing ever happens to these people.
ill wait.
and hope.

Nothing ever happens . . .
Things are different this time.
-
Tough to see how getting into this race is a good idea if you're DNC leadership.
Tough to see how getting into this race is a good idea if you're DNC leadership.
It's going to be worse than this, squaring up of Districts is just going to be "Icing on Cake" (later / elsewhere).
-
Tough to see how getting into this race is a good idea if you're DNC leadership.
I don't think they really have a choice. Trump ordered Texas to find more seats, and they did, redistricting norms be damned. I'm sure the party will continue to find ways to stack the deck mid census cycle.
Dems either do nothing, and massively fall behind, or they do something and fall behind less.
Reps are playing by their own set of rules and Dems need to wake up to that and fully suit. Or we'll just see more stacking the deck by stretching what's possible in favors of conservatives (gerrymandering, vote suppression, etc)
I don't think they really have a choice. Trump ordered Texas to find more seats, and they did, redistricting norms be damned. I'm sure the party will continue to find ways to stack the deck mid census cycle.
Dems either do nothing, and massively fall behind, or they do something and fall behind less.
Reps are playing by their own set of rules and Dems need to wake up to that and fully suit. Or we'll just see more stacking the deck by stretching what's possible in favors of conservatives (gerrymandering, vote suppression, etc)
I'm not sure how you can take a look at the data and suggest that gerrymandering is only abused by one side. These are the consequences of trying to de-ballot and imprison the guy who most voters wanted in office.
-
I don't think they really have a choice. Trump ordered Texas to find more seats, and they did, redistricting norms be damned. I'm sure the party will continue to find ways to stack the deck mid census cycle.
Dems either do nothing, and massively fall behind, or they do something and fall behind less.
Reps are playing by their own set of rules and Dems need to wake up to that and fully suit. Or we'll just see more stacking the deck by stretching what's possible in favors of conservatives (gerrymandering, vote suppression, etc)
I'm not sure how you can take a look at the data and suggest that gerrymandering is only abused by one side. These are the consequences of trying to de-ballot and imprison the guy who most voters wanted in office.
I'm not sure how you can take a look at the data and suggest that gerrymandering is only abused by one side. These are the consequences of trying to de-ballot and imprison the guy who most voters wanted in office.
yet, only one party has allowed our border to be flooded by millions of UNvatted illegal sombitches, to have a new totally dependent demographic vote-wise.











Hello! It looks like you're interested in this conversation, but you don't have an account yet.
Getting fed up of having to scroll through the same posts each visit? When you register for an account, you'll always come back to exactly where you were before, and choose to be notified of new replies (either via email, or push notification). You'll also be able to save bookmarks and upvote posts to show your appreciation to other community members.
With your input, this post could be even better 💗
Register Login